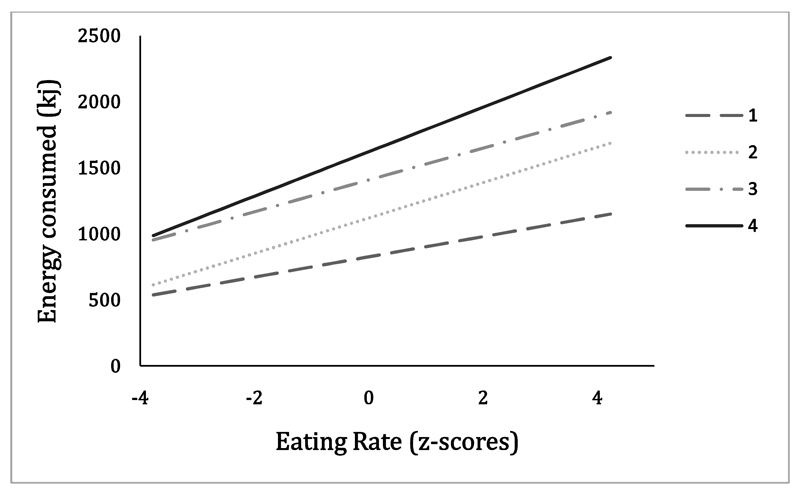
Figure 2.
Simple slopes analysis representing the moderating effects of time spent eating on the relationship between eating rate (z-scores) and energy consumed during lunch (N=386). The four groups represent active mealtime quartiles from 1 (shortest time spent eating) to 4 (longest time spent eating). The following cut-offs were used: 1 (<11.6 minutes), 2 (11.6<15.01 minutes), 3 (15.01<18.8 minutes), 4 (≥18.8 minutes). Interaction 1 (β= 18.26, p<0.001, 95%CI [11.11, 25.42]). Interaction 2 (β=31.99, p<0.001, 95%CI [26.98, 37.00]). Interaction 3 (β= 28.81, p<0.001 95%CI [21.75, 35.87]). Interaction 4 (β=40.18, p<0.001, 95%CI [26.78, 53.58]).

