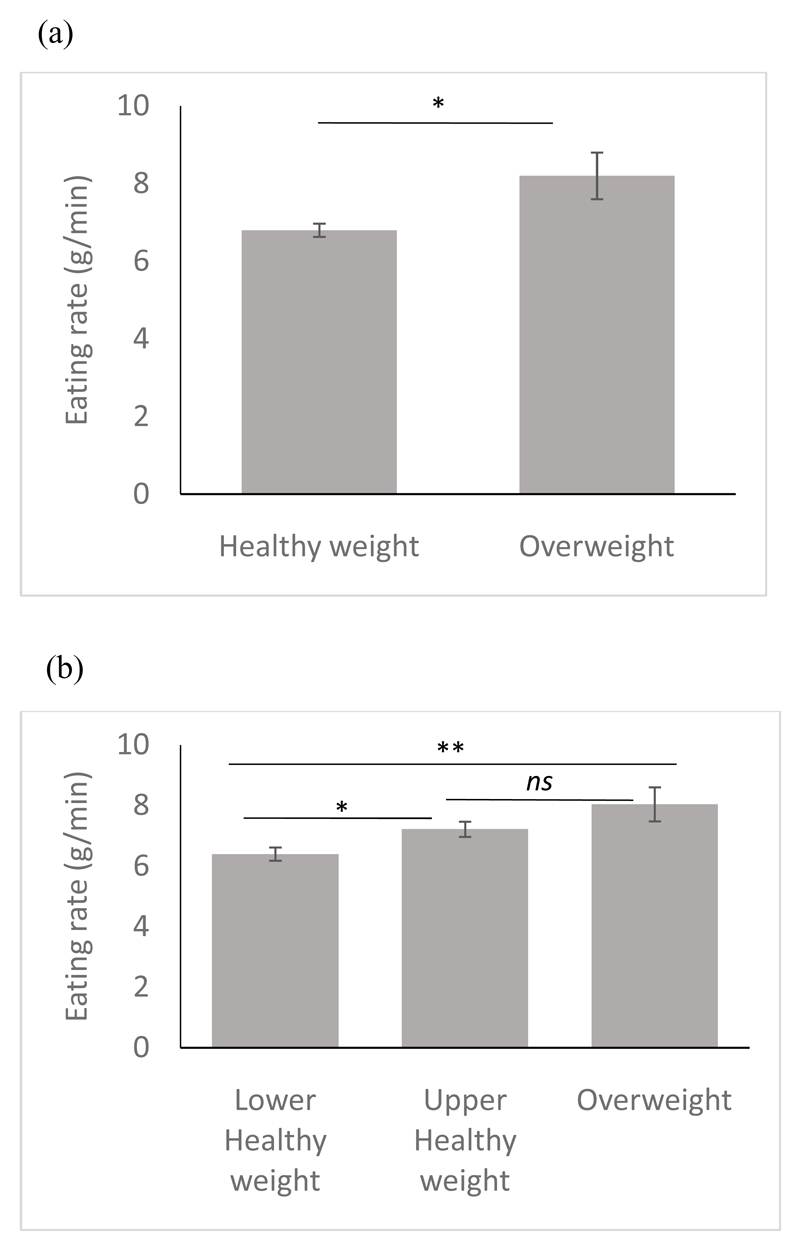
Figure 4.
(a, b) Group differences in eating rate between children classified as healthy weight (n= 347) and overweight (n= 31) by BMI status (a) and three groups of children classified as lower (n=194) and upper range (n=153) of healthy weight and overweight (n= 31), by BMI status (Adjusted Mean ± SEM). *p<0.05;**p<0.01 ns= non-significant.

