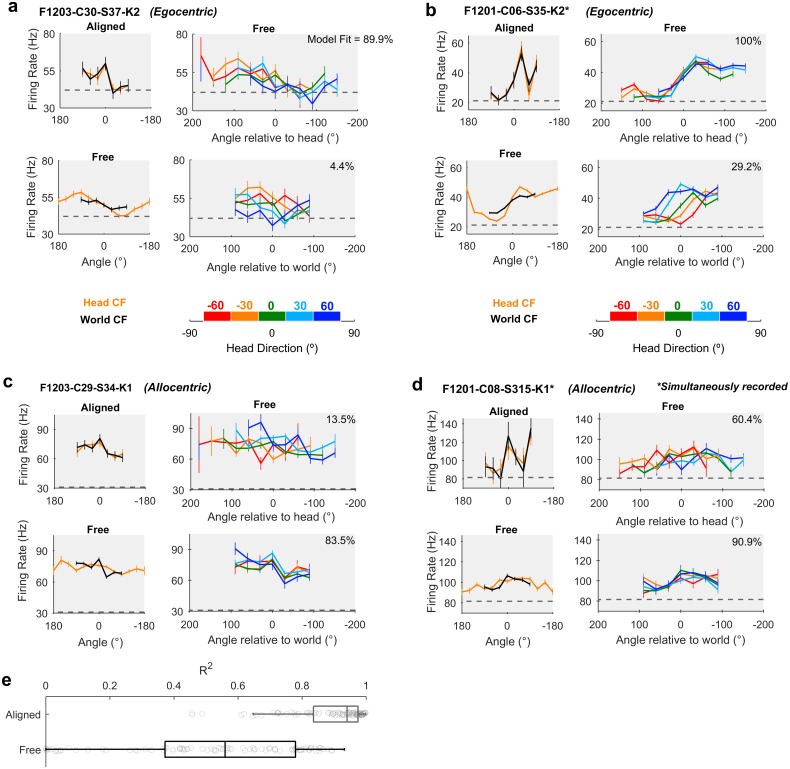
Fig 4. Spatial tuning of egocentric and allocentric units.
a-d: Spatial tuning of four example units that were classified as egocentric (a-b) or allocentric (c-d). In each panel, top left: tuning curves calculated for sound angle in head and world coordinate frames (CFs) when both frames were aligned. Bottom left: tuning curves when head and world CFs were free to vary. Top and bottom right: tuning curves plotted at specific head rotations. Model fit refers to the percentage of explainable deviance calculated according to Fig 6 across all data in which coordinate frames were free to vary. Data for all tuning curves are shown as mean ± SEM firing rates. Dotted lines show the mean background activity measured in the 50 ms before stimulus presentation. e: Correlation coefficients between tuning curves in head and world CFs when aligned or free to vary as the animal foraged around the arena. Boxplots show median and inter-quartile range; symbols show coefficients for individual units. Data available at https://doi.org/10.6084/m9.figshare.4955300.v1.

