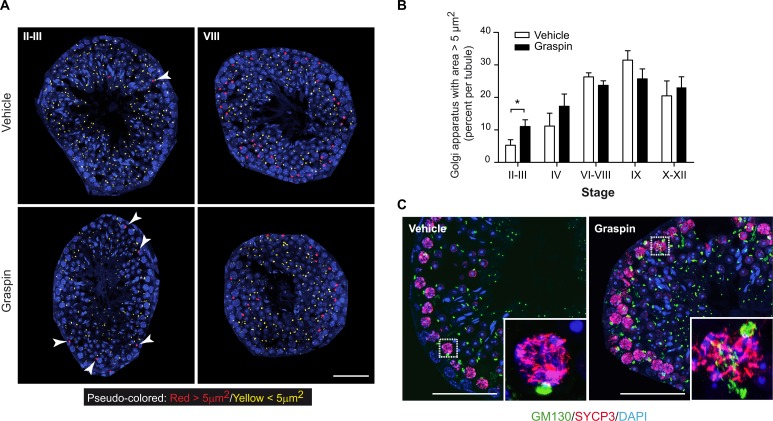
Fig 9. Graspin treatment affects Golgi morphology of germ cells.
(A) Pseudo-colored images of GM130 staining as a function of Golgi area. The threshold value was set to 5μm2 based on analysis of Golgi area distribution in function of seminiferous tubule stages. Representative pseudo-colored images for indicated tubule stages and genotypes are shown. Arrowheads indicate Golgi with area greater than 5 μm2. Note that Golgi with large areas are essentially localized in the periphery of seminiferous tubules. Scale bar, 50 μm. (B) Graph showing the percentages of Golgi area greater than 5 μm2 in function of seminiferous tubule differentiation stages. Images used for quantitative analysis were obtained from three independent samples and the number of tubules analyzed was as follow: II-III, n = 30; IV, n = 12; VI-VIII, n = 47; IX, n = 16; X-XII, n = 28. *: p <0.05. (C) Confocal images of GM130, SYCP3 and DAPI staining of seminiferous tubule sections of P35 treated mice at stage II-III. Scale bar, 50 μm. Inserts: High magnification pictures highlighting GM130 staining in pachytene spermatocytes expressing SYCP3.

