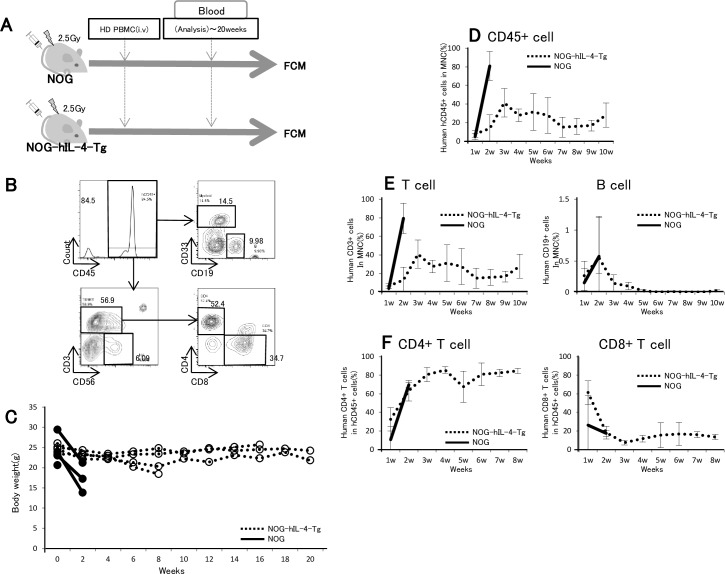
Fig 2. Decreased GVHD symptoms in PBMC-NOG-hIL-4-Tg mice.
A, Experimental protocol for hPBMC transfer to NOG-hIL-4-Tg and conventional NOG mice. Doses of 2.5x10⁶ PBMCs were intravenously transferred into NOG-hIL-4-Tg and NOG mice 1 day after 2.5 Gy irradiation. After cell transfer, human lymphocytes were analyzed by FCM. B, Typical flow cytometric pattern of PBMC-transplanted mice. The CD45+ fraction was further analyzed for CD33+CD19- myeloid cells, CD19+ B cells, CD56+CD3- NK cells, CD3+CD4+ T cells and CD3+CD8+ T cells. The data presented in these panels show the percentages of these cell fractions. C, Suppression of GVHD in NOG-hIL-4-Tg mice. After HD PBMC transplantation, the body weights of NOG-hIL-4 Tg and NOG mice were measured biweekly for 20 weeks. Open circles and dashed lines: individual NOG-hIL-4-Tg mice; closed circles and solid lines: individual NOG mice. D-E, From 1 to 10 weeks after HD PBMC transplantation, the engraftment rates of human PBMCs were analyzed by FCM. D, Human CD45+ cells (%) in mononuclear cells (MNCs). E, Left panel; human CD3+ cells (%) in MNCs, right panel; human CD19+ cells (%) in MNCs. F, From 1 to 8 weeks after HD PBMC transplantation, the engraftment rates of human PBMCs were analyzed. Left panel; CD4+ T cells and CD8+ T cells in human CD3+ cells (%) in hCD45+ cells (%) of the mice, right panel; human CD4+ T cells and CD8+ T cells in human CD3+ cells (%) in hCD45+ cells (%) of the mice. Dotted lines: NOG-hIL-4-Tg mice; solid lines: NOG mice.

