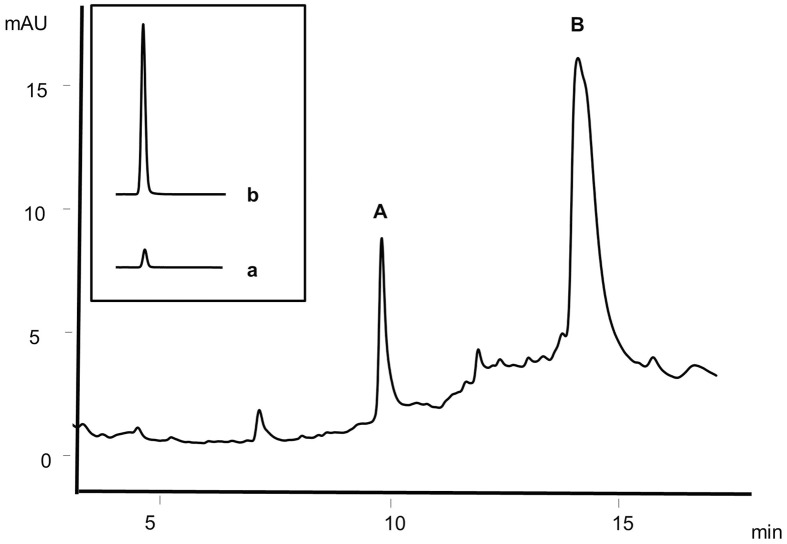
Fig 2. HPLC chromatogram of plasma after treating with de-conjugating enzymes.
A, caffeic acid and B, elagic acid (Internal standard). Inset: Signal areas of caffeic acid transported through Caco-2 cell monolayers; a, caffeic acid signal in the control with no added lauric acid, b, caffeic acid signal in the sample with added lauric acid at 2.5 mmol/L.

