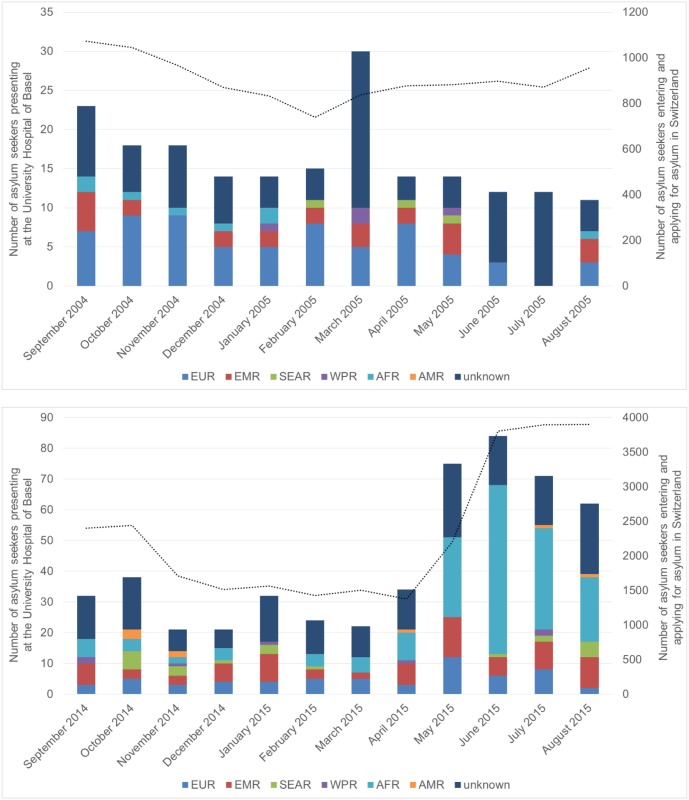
Fig 1. Monthly number of asylum seekers referred to the University Hospital Basel stratified for region of origin.
(A) time period 2004/05 (B) time period 2014/15. AFR: African Region; AMR: Region of the Americas; EMR: Eastern Mediterranean Region; EUR: European Region; SEAR: South-East Asia Region; WPR: Western Pacific Region; unknown: no data about the region of origin available. The bars represent the number of asylum seekers presenting at the University Hospital Basel per month and stratified into region of origin. Corresponding y-axis on the left of the diagram (n = 0–35 and 0–90, respectively). Black dotted line represents the monthly number of all asylum seekers entering Switzerland and applying asylum at any of the 5 national reception and procedure centres. Corresponding y-axis on the right of the diagram (n = 0–1200 and 0–4000, respectively).

