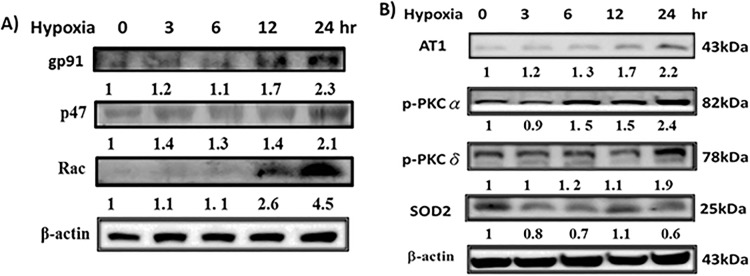
Fig 1. Hypoxia-increased oxidative stress in H9c2 cells.
(A) The level of NADPH oxidase (Nox2-gp91 phox, p47phox, and Rac1) protein expressions. (B) The level of AT1 receptor, p-PKCα and p-PKCδ, and antioxidant enzyme SOD2 protein expressions. ‘Image J’ software was used to calculate the expression level of protein.

