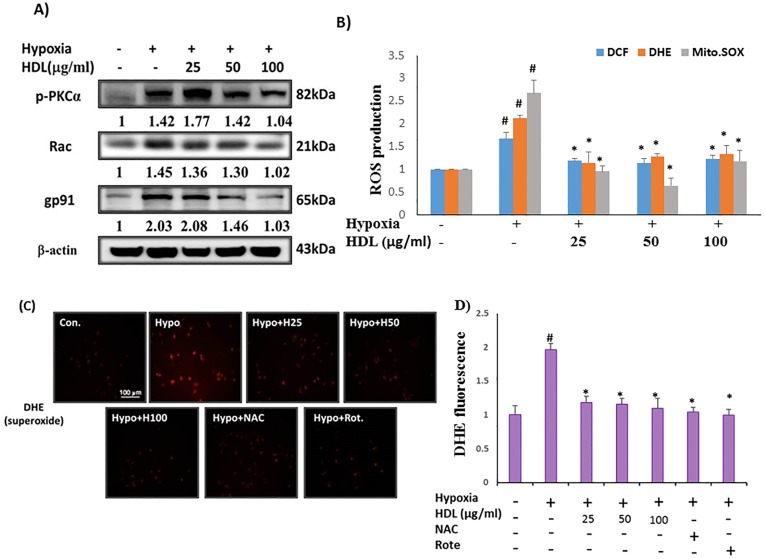
Fig 3. Inhibitory effect of HDL on hypoxia induced ROS production in H9c2 cells.
(A) Representative western blots. ‘Image J’ software was used to calculate the expression level of protein (B). ROS was examined by DCF-AM (10μM), DHE (5μM), and MitoSOX™ (5μM). Fluorescence intensity of cells was measured by flow cytometry. (C) Neonatal cardiomyocytes were treated with HDL (25–100μg/ml) for 2h, or NAC (500 μM), roteone (5 μM), and then incubated with 1%hypoxia for an additional 24h, and followed by 1h incubation with DHE (10μM). Fluorescence intensity of cells was measured by immunofluorescence microscopy (Olympus CKK53). Data showed the means ± SEM of 3 independent analyses.#P<0.05 comparison of control and hypoxia groups, *P<0.05 HDL/ NAC treated groups vs. hypoxia treatment.

