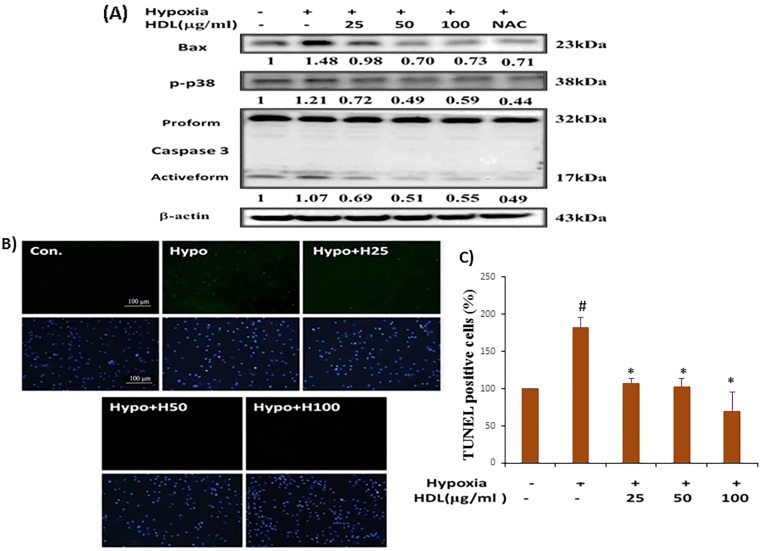
Fig 4. Inhibitory effect of HDL on hypoxia induced MAPK and apoptotic protein expression in H9c2 cells.
(A). Representative western blots. ‘Image J’ software was used to calculate the expression level of protein. (B) Fluorescence images show the cells stained with 4,6-diamidino-2-phenylindole (DAPI) (upper panel) and stained using terminal deoxynucleotidyl transferase dUTP-mediated nick-end labeling (TUNEL) assay (bottom panel), and photomicrographs were from immunofluorescence microscopy (Olympus CKK53). C). Graphical representation of TUNEL assay. #P<0.05 comparison of control and hypoxia groups, *P<0.05 HDL treated groups vs. hypoxia treatment.

