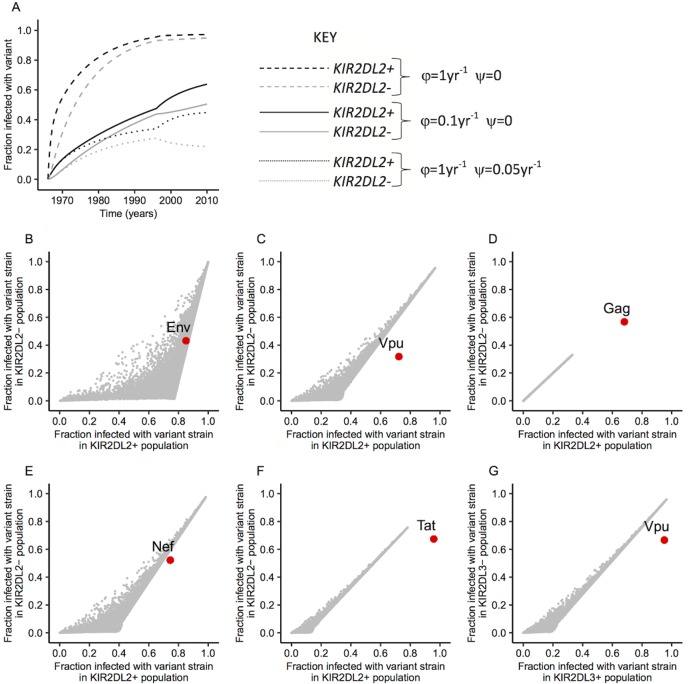
Fig 2. Fraction of the population infected with variant virus.
(A) time course of the fraction of Env-variant-infected individuals in the KIR2DL2+ (black lines) and KIR2DL2– (grey lines) population from the start of the epidemic for three different combinations of escape (φ) and reversion (ψ) rates (solid: φ = 0.1yr-1 and ψ = 0; dashed: φ = 1yr-1 and ψ = 0; dotted: φ = 0.1yr-1 and ψ = 0.05yr-1). The abrupt change in the late 1990s is due to the introduction of combination antiretroviral therapy. Only 3 combinations of escape and reversion shown for ease of visualisation; a total of 100,000 combinations were considered (B-F) Fraction of variant-infected individuals in the KIR2DL2+ and KIR2DL2– population for 100,000 randomly chosen parameter values. Grey dots: model predictions, red circle: observation reported by Alter et al. B: Env, C: Vpu, D: Gag, E: Nef, F: Tat. Model parameters are varied within the ranges given in S3 Table. (G) Predicted and observed variant enrichment for the KIR2DL3-associated polymorphism in Vpu (3).

