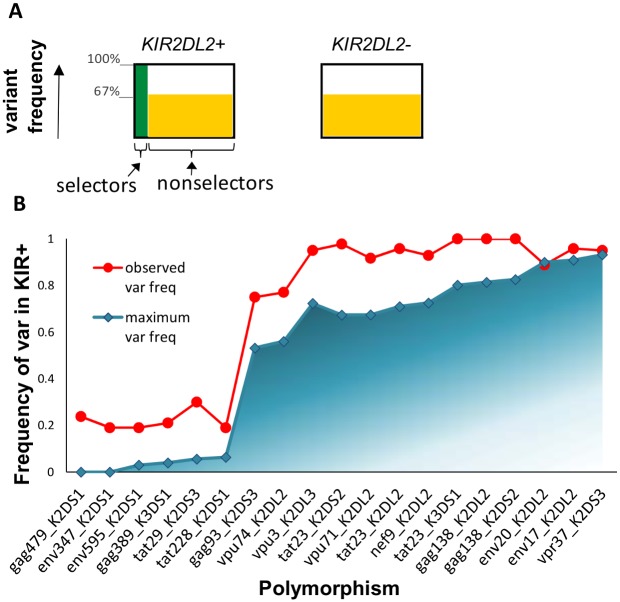
Fig 4. Model-independent approach.
(A) Schematic. Under the hypothesis of Alter et al the frequency of the variant in KIR2DL2+ non-selectors and KIR2DL2- non-selectors will be similar (orange; 67% for the example of Tat(3)). Even if the frequency of the variant in KIR2DL2+ selectors is 100% (green) it is trivial to see that, because of the low frequency of selectors amongst the KIR2DL2+ population, the variant frequency amongst the whole KIR2DL2+ population is low and is similar to that of the KIR2DL2- population. (B) Results. The maximum variant frequency expected (blue) is systematically lower than the observed variant frequency (red) for the majority of the polymorphisms described by Alter et al. The exceptions are Env 17/20:KIR2DL2 and Vpr 37:KIR2DS3 already discussed. Shading indicates that the expected variant frequency can be lower (but not higher) than the maximum variant frequency, i.e. variant frequency can take any point in the shaded region depending on the variant frequency in selectors, the maximum is attained when variant frequency in selectors is 100% (solid blue line).

