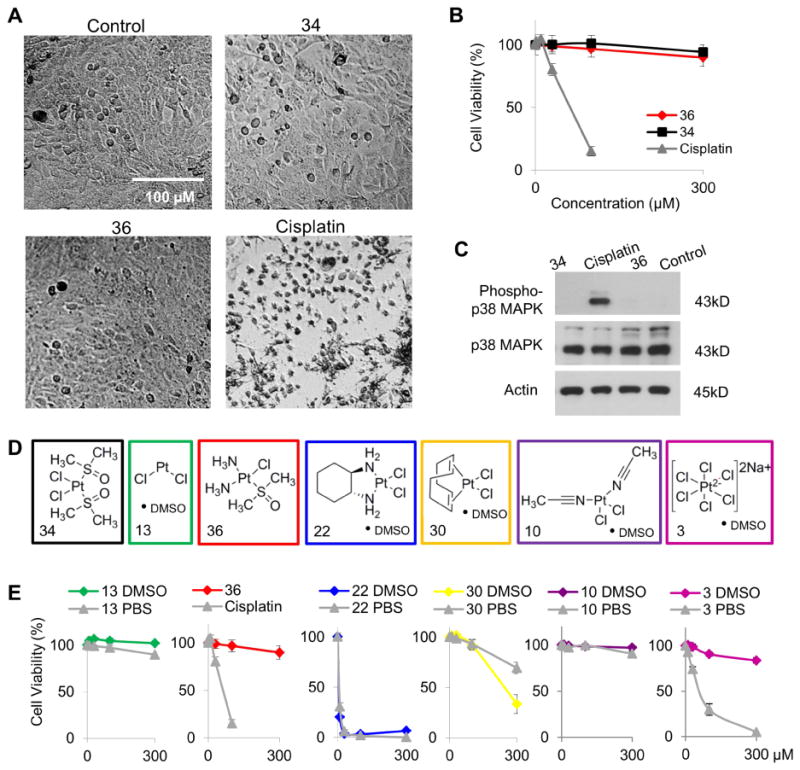
Figure 4. A subset of cisplatin analogues solvated in DMSO exhibit decreased cytotoxicity in human cells.

A) Images of H1975 cells treated with vehicle, 34, 36, or cisplatin. B) Cell viability over increasing concentrations of 36 (red), cisplatin (gray) and 34 (black). Data represented as the mean ± SD. C) Western blots for phospho-p38 MAPK on lysates from cells treated with vehicle, 34, 36, or cisplatin. Complexes from each structural class (D) were dissolved in PBS (gray) or DMSO (color) and cell viability over increasing concentrations was determined (E). Also see Figure S1.
