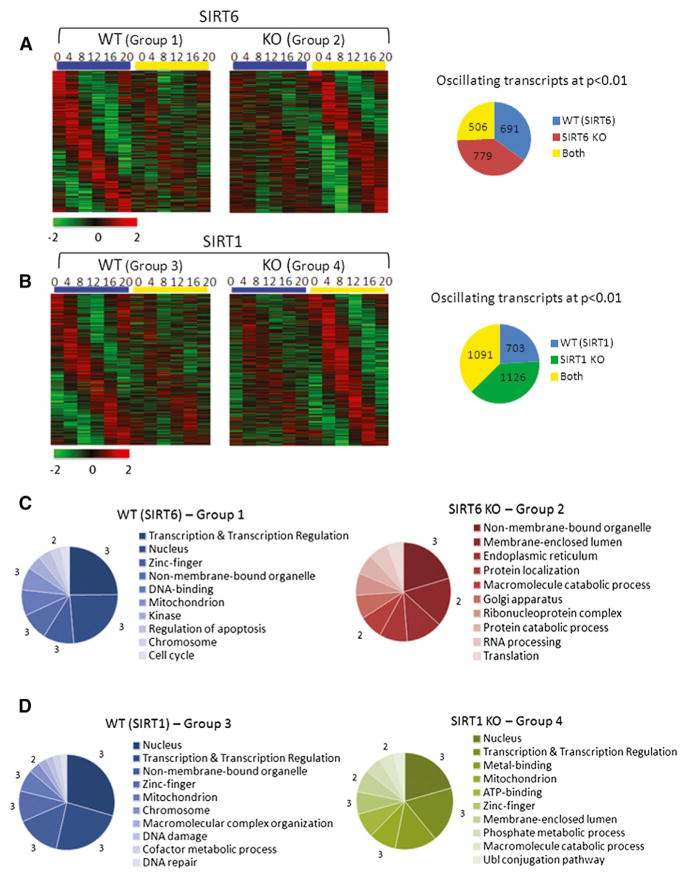
Figure 1. The SIRT6 and SIRT1 Circadian Transcriptomes.
(A and B) DNA microarray analysis was performed using mouse liver total RNA from ZT 0, 4, 8, 12, 16, and 20. Using JTK_cycle, genes selected to be circadian at a p value < 0.01 are displayed as heat maps for WT and SIRT6 KO livers (A) and WT and SIRT1 KO livers (B). Heat maps on the left side show genes that oscillate in WT (groups 1 and 3) with dampened or flat gene expression in SIRT6 KO (group 2) or SIRT1 KO (group 4). Heat maps on the right side display genes with more robust circadian expression when the sirtuins are disrupted. Pie charts indicate actual numbers of circadian genes for the SIRT6 and SIRT1 transcriptomes. Biological function analysis was performed using DAVID. GO terms for molecular function, biological process, and cellular component were used.
(C and D) Top ten GO terms, based on a 0.01 p value cutoff, are shown for the SIRT6 transcriptome (C) and the SIRT1 transcriptome (D). Numbers bordering different pie slices indicate how many times that GO term was found in the four pie charts shown.

