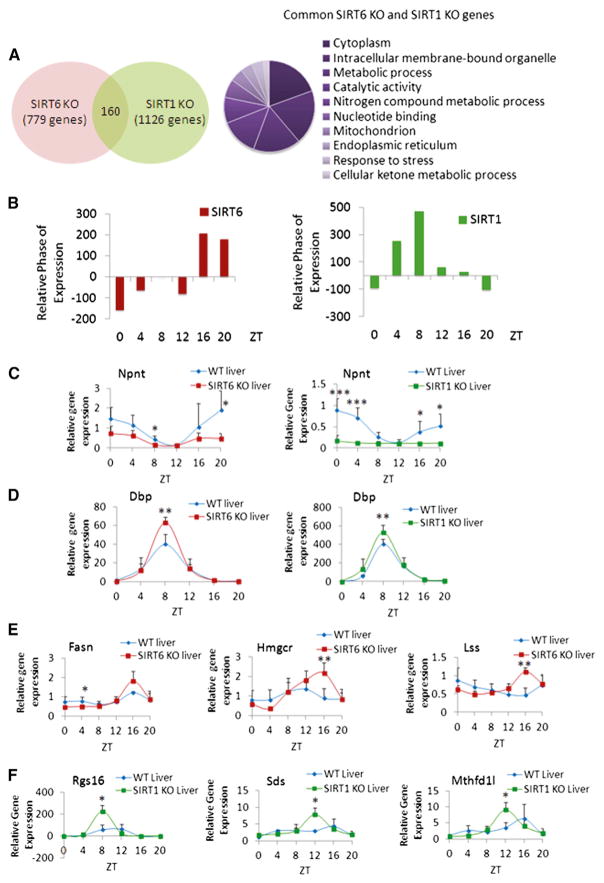
Figure 2. Comparison of SIRT6 and SIRT1-Dependent Circadian Gene Expression.
(A) Venn diagram displays genes with common circadian expression profiles in SIRT6 KO and SIRT1 KO microarray data sets. Right panel illustrates GO terms enriched in the 160 common genes similarly regulated by SIRT6 and SIRT1. Top ten GO terms (molecular function, biological process, and cellular component) were selected based on a 0.01 p value cutoff using DAVID.
(B) Relative phase of expression of significant genes (p value < 0.01) from SIRT6 and SIRT1 microarray data. Phase of SIRT6 KO or SIRT1 KO genes at indicated ZTs is shown relative to WT.
(C) Gene expression profiles of Npnt in WT and SIRT6 KO or SIRT1 KO mouse liver based on quantitative real-time PCR analysis. Total RNA was extracted from three to five independent livers at indicated ZTs.
(D) Gene expression, based on real-time PCR, for Dbp in WT and SIRT6/SIRT1 disrupted livers.
(E) Expression profiles for Fasn, Hmgcr, and Lss genes with increased circadian amplitude exclusively in SIRT6 KO versus WT.
(F) Expression of genes oscillating more robustly only in SIRT1 KO livers versus WT, including Rgs16, Sds, and Mthfd1l. Gene expression was normalized relative to 18S rRNA expression. Error bars indicate SEM. Significance was calculated using Student’s t test and *, **, and *** indicate p value cutoffs of 0.05, 0.01, and 0.001, respectively. Primer sequences used for gene expression analysis are in Table S2.

