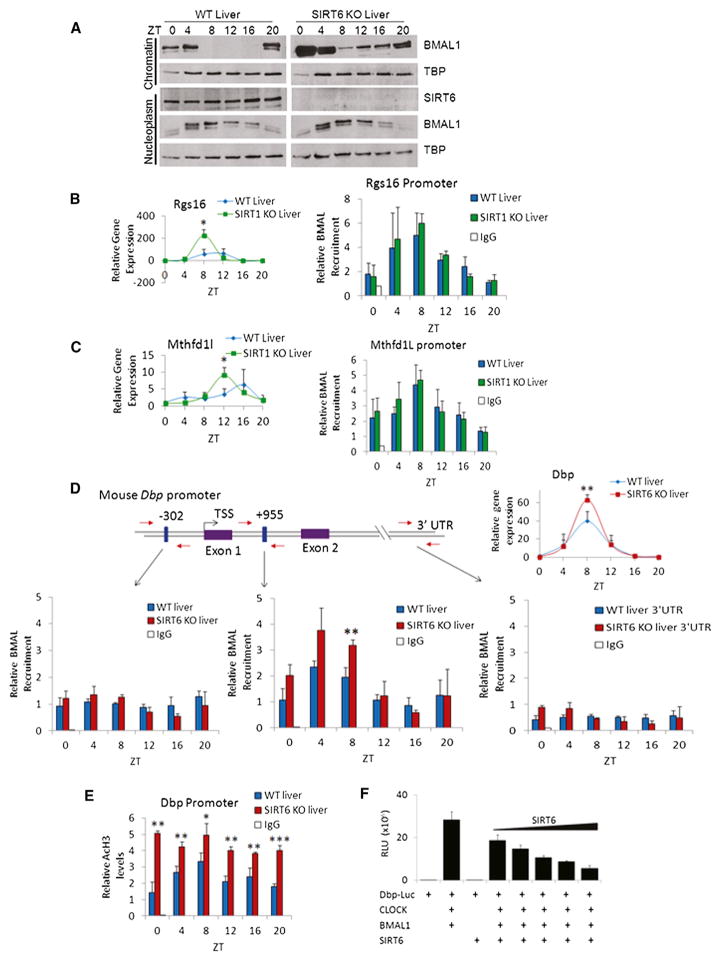
Figure 3. SIRT6 Regulates the Circadian Transcriptional Machinery.
(A) Western analysis of fractionated liver (nucleoplasm and chromatin-enriched fractions) at indicated ZTs.
(B and C) ChIP analysis in WT and SIRT1 KO livers at indicated ZTs using n = 3 independent livers per genotype and time point. Left panels display gene expression profile, and right panels display BMAL1 recruitment to Rgs16 and Mthfd1l gene promoters by ChIP, as compared to rabbit IgG negative control.
(D) BMAL1 ChIP analysis in WT and SIRT6 KO liver to the Dbp promoter and Intron 1. Schematic of the Dbp promoter: blue boxes illustrate locations of E boxes, and red arrows indicate locations of real-time PCR primers used for ChIP. Numbers shown above E boxes indicate locations relative to the TSS. Dbp expression is on the right. BMAL1 ChIP data illustrate recruitment to the Dbp promoter, Intron I, and 3′ UTR regions.
(E) AcH3 ChIP data at the Dbp Promoter in WT and SIRT6 KO livers at indicated ZTs.
(F) Luciferase assays were performed in JEG3 and HEK293 cells by ectopically expressing CLOCK, BMAL1, and SIRT6 with a Dbp luciferase reporter. 50–100 ng of CLOCK and BMAL1 expression plasmids were expressed with increasing amounts of SIRT6 (2–50 ng). Error bars indicate SEM. For real-time PCR and ChIP data, significance was calculated using Student’s t test and *, **, and *** indicate p value cutoffs of 0.05, 0.01, and 0.001, respectively. Primer sequences used for gene expression and ChIP analysis are listed in Tables S2 and S3.

