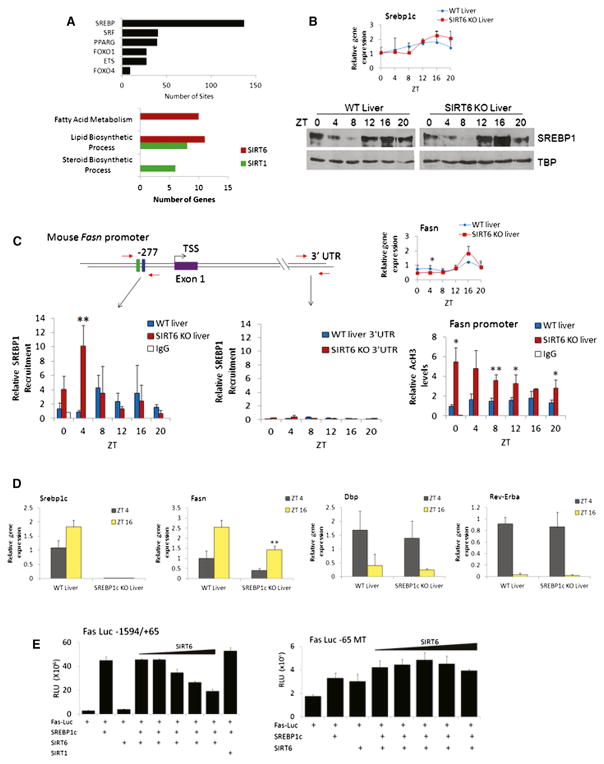
Figure 5. SIRT6 Modulates SREBP-Mediated Circadian Transcription.
(A) MotifMap analysis of transcription factor binding sites enriched in gene promoters with altered expression when SIRT6 is disrupted (p value cutoff of 0.01 using JTK_cycle) (top). Search criteria were limited to 1 kb upstream of the TSS, with an FDR cutoff of 0.2 and a BBLS score of 0. Bottom displays overlapping SREBP1 target genes with SIRT6 and SIRT1-dependent genes. Genes are grouped in biological function by GO terms indicated.
(B) Gene expression as determined by real-time PCR and protein expression by western of Srebp-1c in WT and SIRT6 KO nuclear extracts.
(C) ChIP analysis on the Fasn promoter in WT and SIRT6 KO livers. Schematic of the Fasn promoter, with SRE-1 (green box) and E box (blue box) sites indicated. Right panel indicates Fasn gene expression, and bottom panel displays SREBP1 recruitment to the Fasn promoter and 3′ UTR by ChIP. AcH3 levels as determined by ChIP analysis at the Fasn promoter are shown.
(D) Gene expression as determined by real-time PCR of Srebp-1c, Fasn, Dbp, and Rev-Erbα at ZT4 and ZT16 in WT and SREBP-1c KO livers. Gene expression was normalized relative to 18S rRNA expression.
(E) Luciferase assays in JEG3 and HEK293 cells using two different Fasn luciferase reporters ectopically expressed with SREBP-1c (50 ng), SIRT6 (2–50 ng) or SIRT1 (50 ng). Left panel displays data using the Fasn-Luc −1594/+65 reporter, which contains the SRE binding site for SREBP1c-mediated transcription. Right panel shows luciferase activity using the Fas-Luc −65 MT reporter. Error bars indicate SEM. For real-time PCR and ChIP data, significance was calculated using Student’s t test, and *, **, and *** indicate p value cutoffs of 0.05, 0.01, and 0.001, respectively. Primer sequences used for gene expression and ChIP analysis are listed in Tables S2 and S3.

