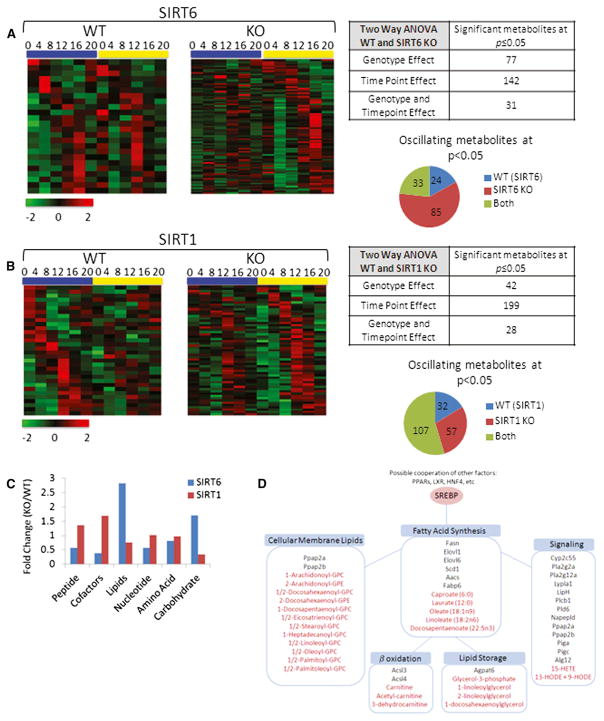
Figure 6. The SIRT6 and SIRT1 Circadian Metabolomes.
(A and B) Heat maps displaying oscillating metabolites as determined by JTK_cycle (p value < 0.05) for SIRT6 (A) and SIRT1 (B) metabolomes. Left panels display circadian metabolites exclusively in WT liver, and right panels show metabolites with more robust oscillation when the sirtuin is disrupted. Tables and pie charts indicate number of significant metabolites using ANOVA and JTK_cycle at p value < 0.05 for time point and genotype.
(C) Biological classification of significant circadian metabolites for SIRT6 and SIRT1. Metabolites were grouped into six biological classifications indicated, and total numbers of significant metabolites in SIRT KOs were normalized to WT livers.
(D) Fatty acid metabolic pathways are outlined, and significantly disrupted genes or metabolites for SIRT6 are shown. Genes are indicated in black, and metabolites are indicated in red font.

