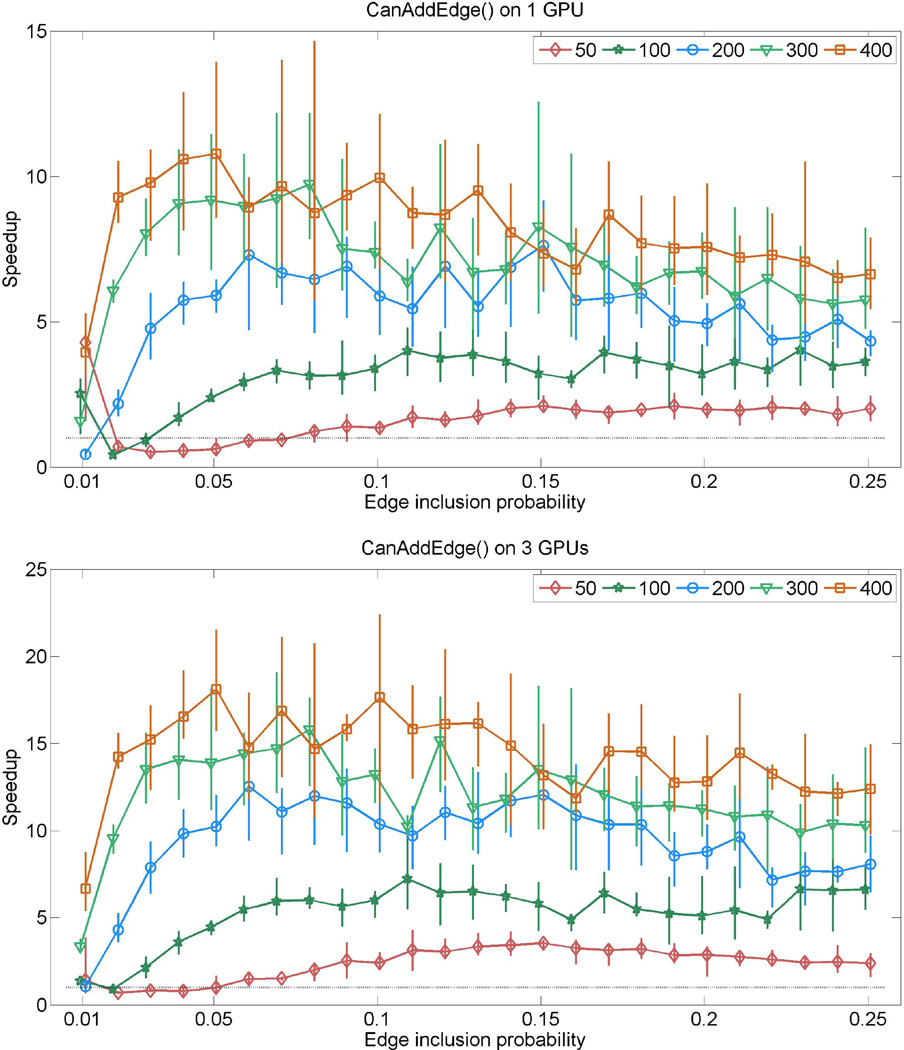
Figure 2.
Relative speedups (runtime on CPU/runtime on GPUs) attained by CanAddEdge() for random graphs sampled with various edge-inclusion probabilities. The top panel shows results from using one GeForce GTX 285 GPU, where the bottom panel shows results from using all three GPUs described in sec. 5.1. The five curves in each panel respectively correspond to graphs with 50, 100, 200, 300 and 400 nodes. Each curve shows average speedup for a given dimension, where the associated vertical bars represent the range of speedup (min to max) observed for the given edge-inclusion probability.

