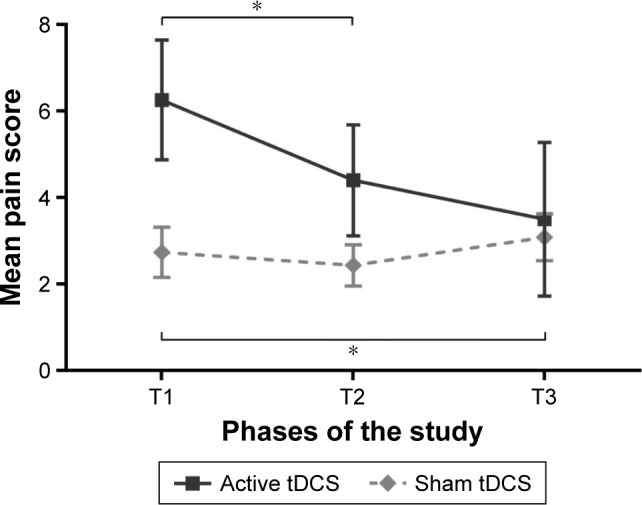
Figure 3.

The average daily pain for sham and active treatment groups gathered using the pain logbook. T1 represents the 7 days of baseline, T2 corresponds to the 5 days of tDCS treatments and T3 represents the 7 days of follow-up. Each point represents a group mean ± standard error of mean. There was a significant difference between T1 and T2 in the active tDCS group and between T1 and T3 in sham tDCS group. *Statistically significant (P<0.05).
Abbreviations: tDCS, transcranial direct current stimulation; T1, baseline; T2, tDCS treatments; T3, follow-up.
