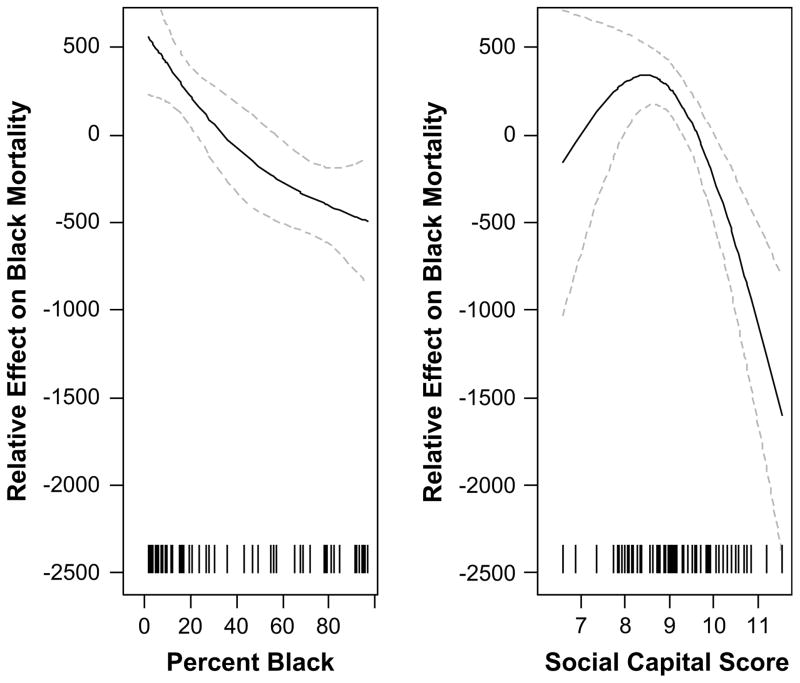
Fig. 2.
Non-linear effects of percent black and social capital score on mean levels of black age-adjusted mortality. Solid lines are predicted values from the linear regression model and dashed lines are 95% confidence intervals. Regions where the 95% CI include zero are those with no statistical evidence of an effect. Hatches along the X-axis indicate the neighborhood data points. The precision of the estimates is higher in regions of the curve with more data points.

