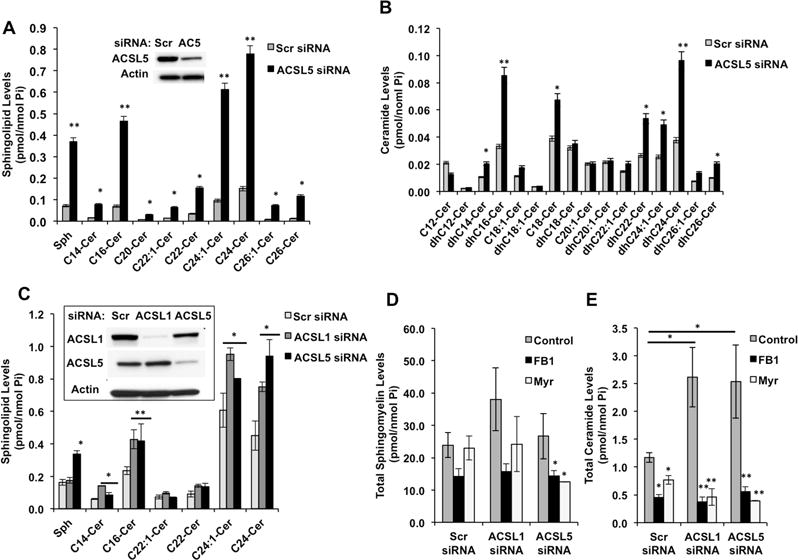
Figure 3. Silencing of ACSL’s Induce Ceramide Accumulation.

(A) Cellular sphingosine and ceramide levels were measured by LC/MS after ACSL5 silencing. ACSL5 abundance after siRNA transfections (inset).
(B) Dihydroceramide levels were measured in cells transfected with Scr (control) or ACSL5 siRNAs.
(C) Sphingosine and ceramide levels were measured in cells transfected with All Star (control), ACSL1, or ACSL5 siRNAs individually. Down regulation of ACSL1 and ACSL5 was confirmed by Western Blotting (inset).
(D and E) Total sphingomyelin and ceramide levels of cells transfected with indicated siRNAs and treated with PBS (Control), Fumonisin B1 (FB1), or Myriocin (Myr) were measured by LC/MS.
Results are expressed as mean of three independent experiments with error bars representing ± SEM. *p <0.05 and ** p< 0.01.
