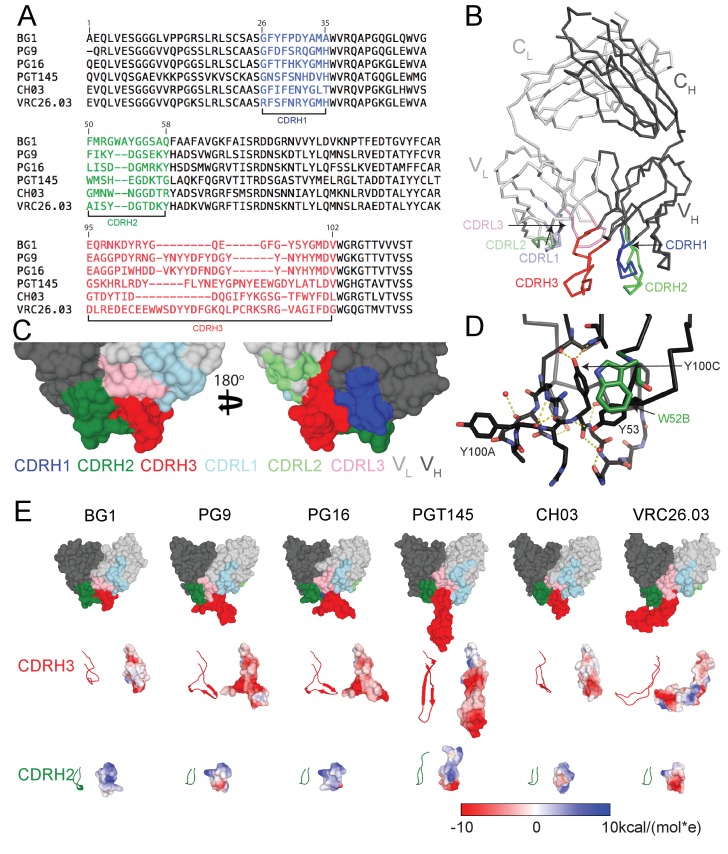
Figure 1. Comparison of BG1 and other V1V2 bNAbs.
(A) Sequences of the HCs of BG1 and representative other V1V2 bNAbs. Residue numbering (Kabat) refers to BG1, and the CDRs were defined using AbM (Swindells et al., 2017). (B) Crystal structure of BG1 Fab with highlighted CDRs. (C) Space-filling representations of antigen-binding site of BG1 in two orientations with CDRs highlighted. (D) Hydrogen bonds (dotted yellow lines) contributing to compact structure of CDRH3. Water molecules shown as red spheres. (E) Top: Space-filling representations of VH-VL domains of selected V1V2 bNAbs (BG1: this study; PG9: PDB 3U4E; PG16: PDB 3 MUG; PGT145: PDB 3U1S; CH03: PDB 5ESV; VRC26.03: PDB 4OD1). Residues within CDRs are highlighted. CDRH3 (middle) and CDRH2 (bottom) loops shown in ribbon (left) and space-filling (right) representations. Electrostatic potentials are shown on the space filling representations using blue and red for positive and negative electrostatic potentials, respectively.


