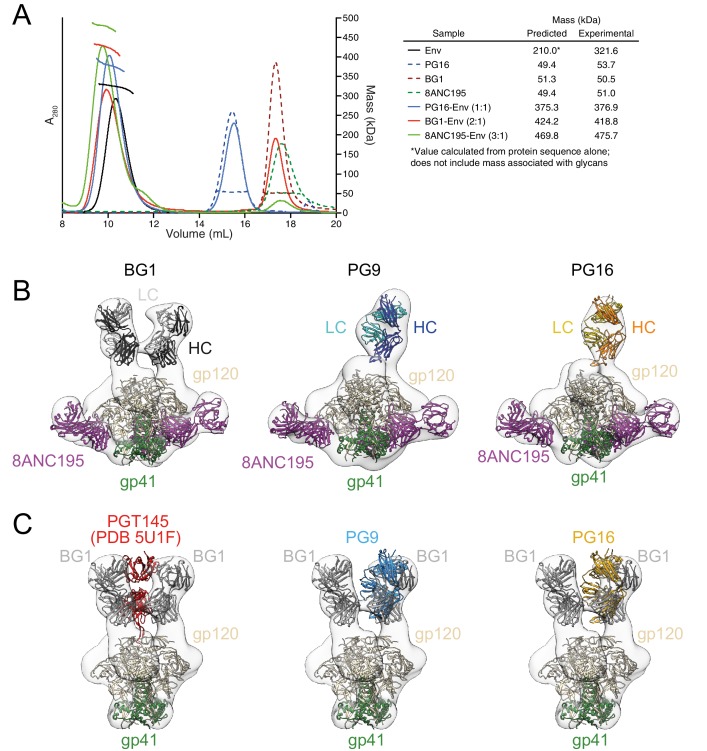
Figure 2. Fab-Env binding stoichiometries for V1V2 bNAbs.
(A) SEC-MALS profiles for BG505 SOSIP.664 Env trimer and complexes of Env trimer with BG1, PG16, and 8ANC195 Fabs. The absorbance at 280 nm (left y-axis) is plotted against elution volume from a Superdex 200 10/300 GL gel filtration column and overlaid with the molar mass determined for each peak (right y-axis). Predicted and calculated molecular masses are shown in the table. (B) Negative-stain single particle EM reconstructions BG1-Env-8ANC195, PG9-Env-8ANC195, and PG16-Env-8ANC195 complexes. EM density was fit with coordinates for the indicated Fabs and for BG505 Env trimer. (C) Density and coordinates from the BG1-Env portion of the BG1-Env-8ANC195 reconstruction (density for 8ANC195 Fabs removed) with coordinates for the indicated Fabs superimposed. The Env trimer portion from EM structures of complexes of PGT145-Env (PDB 5U1F), PG9-Env (panel B), or PG16-Env (panel B) were superimposed with the Env trimer portion of the BG1-Env-8ANC195 structure (panel B).
DOI: http://dx.doi.org/10.7554/eLife.27389.005


