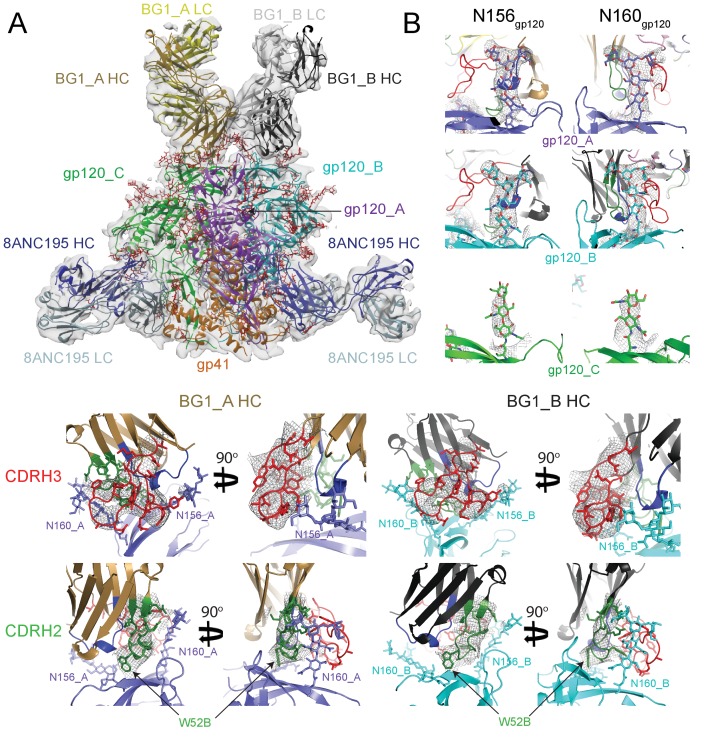
Figure 3. ~6.2 Å cryo-EM reconstruction of a BG1-Env-8ANC195 complex.
(A) EM density fit by coordinates for BG1_A (HC in brown; LC in yellow), BG1_B (HC in dark gray; LC in light gray), gp120s associated with BG1_A and BG1_B Fabs in purple and cyan, respectively; gp120_C in green, gp41 in orange, and 8ANC195 Fabs in dark blue (HC) and light blue (LC). (B) Close-up views of densities contoured at 6.0σ (0.0378 e/Å3) for glycans attached to Asn156gp120 and Asn160gp120 in the three gp120 protomers of Env trimer. Glycan residues built into the cryo-EM map densities are shown as sticks with oxygen atoms in red and nitrogen atoms in blue. (C, D) Close-up views of densities contoured at 6.0σ (0.0378 e/Å3) surrounding CDRH3 (panel C) and CDRH2 (panel D) in BG1-gp120_A and BG1_B-gp120_B interactions. Asn156gp120 and Asn160gp120 glycans are shown as sticks. CDRH2 residue Trp54 (Figure 1D) is identified with an arrow.


