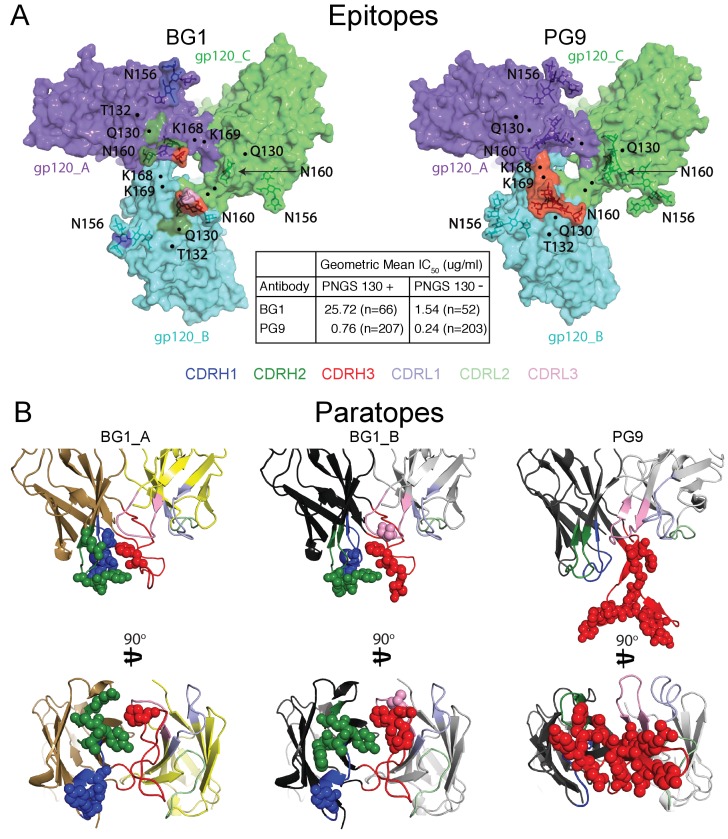
Figure 5. Comparison of BG1 and PG9 epitopes and paratopes.
(A) Epitopes on Env trimer (top view surface representations) were defined as protein or glycan residues whose Cα (for protein) or C1 (for glycans) atom was within 7 Å of the bound Fab. Contacts on Env are color-coded to indicate which CDR loop made the contact (CDRH3 in red, CDRH2 in green, and CDRH1 in dark blue). Glycans are shown as sticks with a nearby label to identify the glycan as attached to either Asn156gp120 or Asn160gp120, and locations of residues of interest (Lys168gp120, Lys169gp120, and Gln130gp120) are indicated by black dots. Center box compares geometric mean IC50 values for BG1 and PG9 IgGs evaluated against HIV-1 strains either containing or not containing a PNGS at position 130 (number of HIV-1 strains indicated in the parentheses). IC50values > 50 µg/mL set to 50 µg/mL for geometric mean calculations. (B) Paratopes on BG1_A, BG1_B, and PG9 Fabs indicated by spheres on ribbon representations of VH-VL domains shown in two orientations related by a 90˚ rotation. CDRs are color coded as in panel A.
DOI: http://dx.doi.org/10.7554/eLife.27389.015


