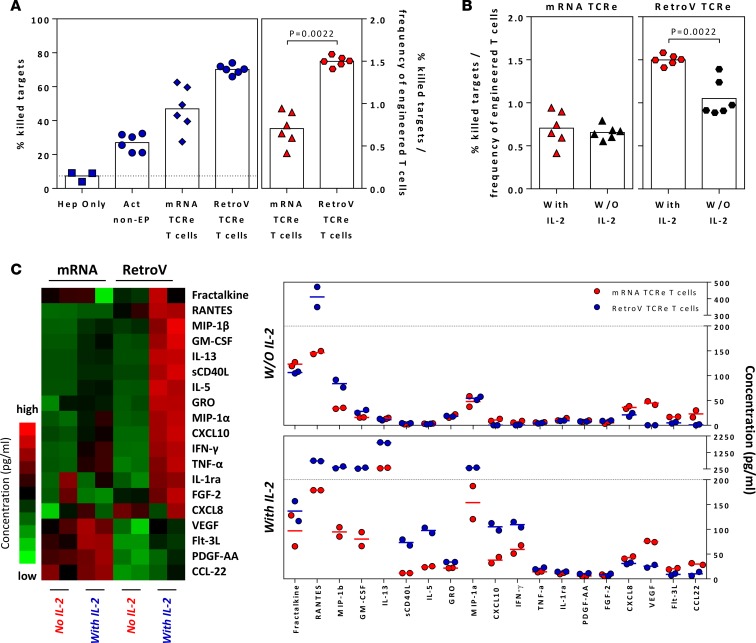
Figure 3. Different preparations of engineered T cells have varying antitumor responses.
(A) The mean percentage of killed target cells when different engineered T cells were seeded into the microdevices in the presence of exogenous IL-2 is shown in blue. The mean percentage of killed target cells normalized to the frequency of successfully engineered T cells is shown in red. Each dot represents a single experiment, and devices without engineered T cells or seeded with nonelectroporated T cells were included as controls. Statistical significance was evaluated with 2-tailed t test. (B) The normalized mean percentage of killed target cells (similar to above) when different engineered T cells were seeded into the microdevices in the presence or absence of exogenous IL-2. Each dot represents a single experiment. Statistical significance was evaluated with 2-tailed t test. (C) Heatmap of the relative concentration of soluble factors detected in the supernatants collected from microdevices, with indicated engineered T cells and IL-2 supplementation, and dot plots showing the summary of the concentration of detected soluble factors. Factors with detected concentrations of less than 10 pg/ml in all samples were removed from analysis. Each column represents a single experiment.

