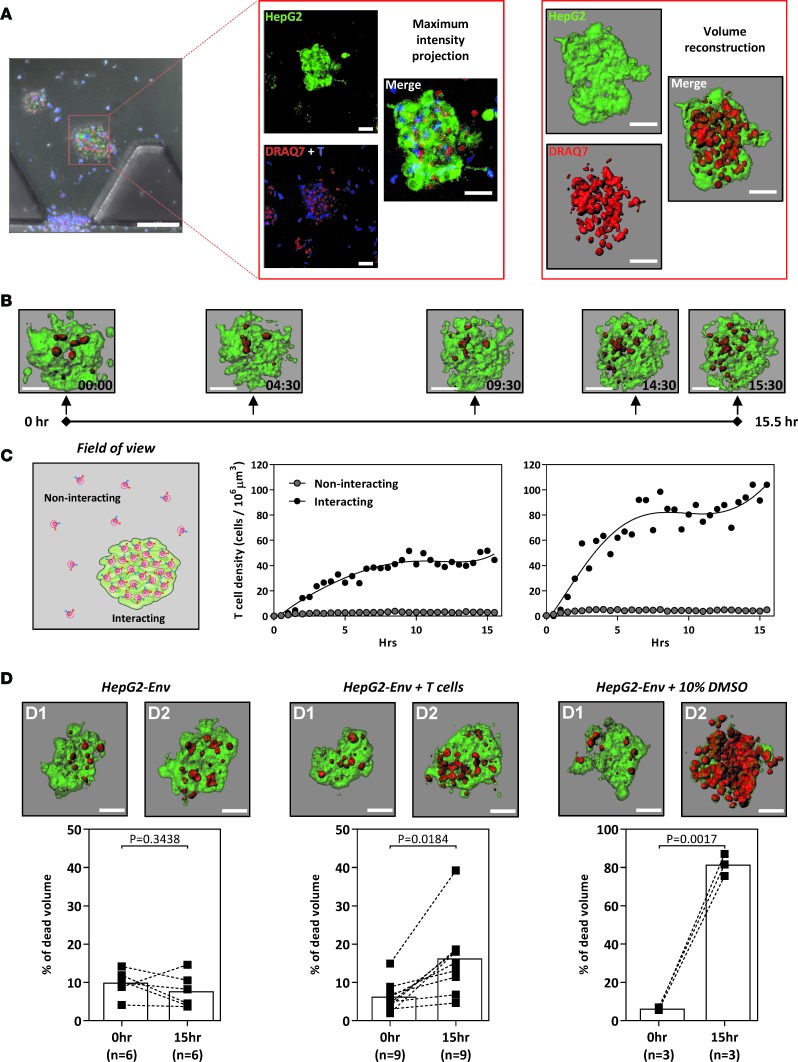
Figure 4. TCR-engineered T cells lyse hepatocellular carcinoma aggregates.
(A) Schematic illustrating the 3D volume reconstruction of HepG2-Env aggregates embedded in the collagen gel of the microdevice (scale bar: 100 μm [left]; 50 μm [middle and right]). (B) Timeline depicting a representative 15.5-hour live-imaging assay (~30-minute acquisition intervals; experiment performed twice), in which engineered HBV Env183-191–specific T cells were introduced into the device containing GFP-expressing HepG2-Env aggregates cultured in a 3D collagen matrix. DRAQ7 was added in the culture media labeling dead cells red. The reconstructed aggregates were shown at the indicated times (scale bar: 50 μm). (C) The density of engineered T cells randomly moving in empty collagen gel regions (noninteracting) and within HepG2-Env aggregates (interacting) was quantified in 2 live-imaging experiments depicted. (D) Representative reconstructed aggregates at 0 hours and after overnight incubation alone (left), with the addition of 10% DMSO or with engineered HBV-specific T cells (scale bar: 50 μm). The summary of the percentage of dead aggregates was quantified for the respective conditions. Each dot represents a single experiment. Scale bar: 50 μM. Statistical significance was evaluated with 2-tailed t test.

