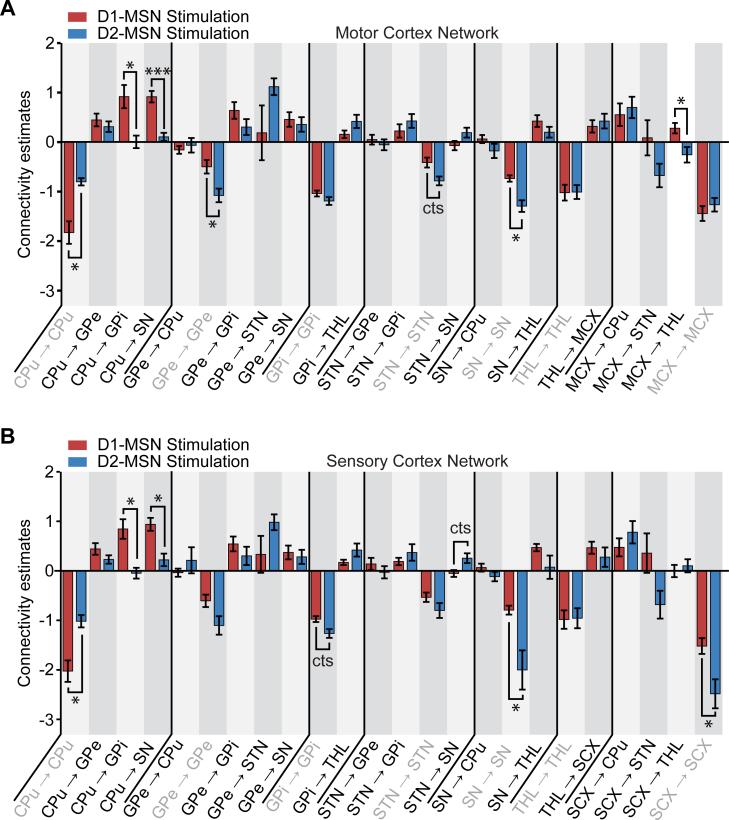
Figure 6. Comparison of connectivity estimates between D1- and D2-MSN stimulation network models.
A, Comparison of connectivity estimates between D1- and D2-MSN stimulations for the MCX network model. Statistical differences were observed in the connectivity estimates between D1- and D2-MSN stimulations. B, Comparison of connectivity estimates between D1- and D2-MSN stimulations for the SCX network model. Statisticaldifferences were observed in the connectivity estimates between D1- and D2-MSN stimulations. Error bars represent the standard error of the connectivity estimates over subjects. * indicates P < 0.05 and *** indicates P < 0.001 across subjects after applying a multiple comparison correction across a priori connections with FDR; “cts” indicates a close-to-significant difference (P < 0.10).

