
Fig. 4. Model validation for BLCC-induced gene expression changes in chronic VLUs.
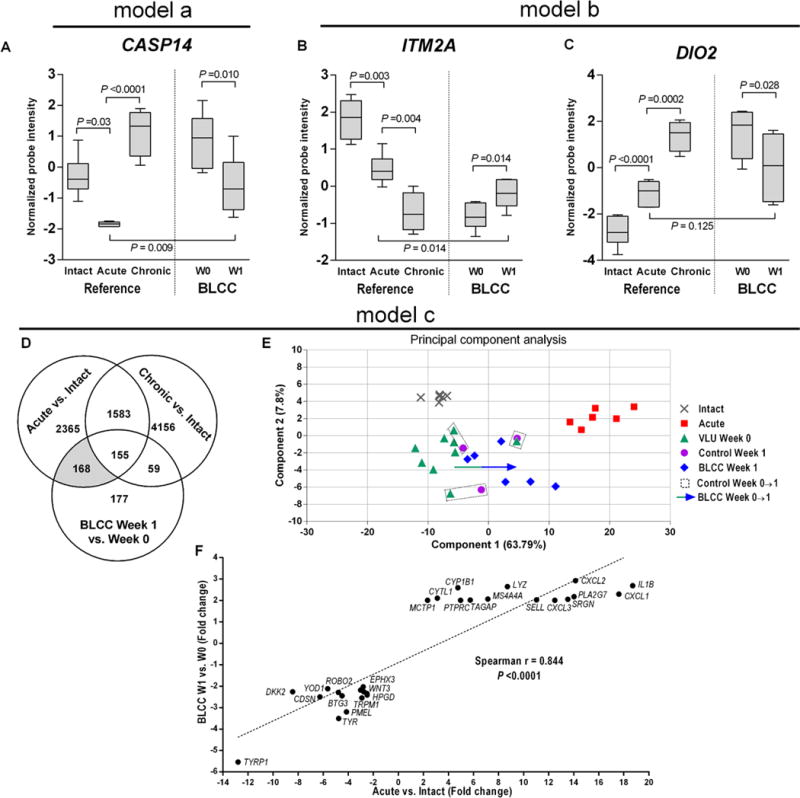
Expressions of gene aggregates identified in Fig. 2A were explored in the context of the models proposed in Fig. 2B by comparing reference profiles of intact unwounded skin, healing acute wounds on post-injury day 3, and the non-healing edge of chronic venous leg ulcers to pairs of non-healing VLUs before and after BLCC treatment. Data are represented as box and whisker plots of microarray probe expression intensities in the unwounded skin (“Intact”, n=6), healing acute wounds (“Acute”, n=6), non-healing chronic VLUs (“Chronic”, n=3), as well as 6 pairs of BLCC-treated VLUs (“W0” and “W1”). (A) Model “a”: Caspase 14 (CASP14) expression in intact, acute, and chronic reference samples compared to BLCC-treated VLUs at W0 and W1. (B- C). Model “b”: Integral membrane protein 2A (ITM2A) and thyroid hormone deiodinase (DIO2) expression in intact, acute, and chronic reference samples compared to BLCC-treated VLUs at W0 and W1. P values were determined by 2-tailed paired t-test (Acute vs. Intact, BLCC W1 vs W0) or 2-tailed moderated t-test (Acute vs. Chronic, BLCC W1 vs. Acute). (D–E) Model “c”: 4-component Principal Component Analysis (PCA) of 168 microarray probes common to healing acute wounds and chronic VLUs post-BLCC (shaded in grey); plot of components 1 and 2 which comprise over 70% of the variation. Arrow represents the trend towards acute wound expression in 1+ PCA components for pairs of BLCC-treated VLUs (BLCC Week 0 to 1) which is absent in Control-treated pairs (dotted rectangles). (F) Plot of changes in gene expression for BLCC-treated VLUs (fold change, W0 to W1) and changes in gene expression between acute wounds and intact skin as determined by Spearman’s nonparametric rank order correlation (2-tailed P<0.0001).