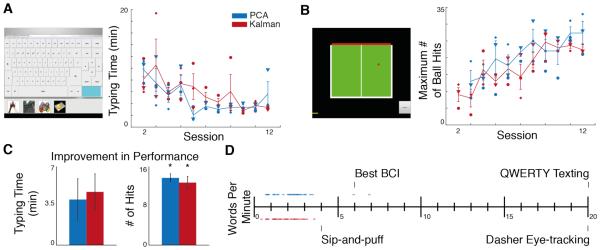
Fig. 6. SCI participant performance during typing and pong.
(A) Screenshot of the typing interface (left) and participant performance at each typing session (right) is shown for PCA (blue) and Kalman (red) SCI participants. Each marker type denotes a different participant’s mean performance at that session. The lines represent the participant averages (n = 3 participants, one trial per session). (B) Screenshot of the pong game (left) and participant performance at each pong session (right) is shown for PCA and Kalman participants. PCA participants began playing pong until the 3rd session. (C) Improvement in performance is shown for each task. Data are means ± SEM (bars). (D) Typing speed in words per minute for each SCI participant overlaid over a scale showing typing speeds for other devices (adapted from [38]).

