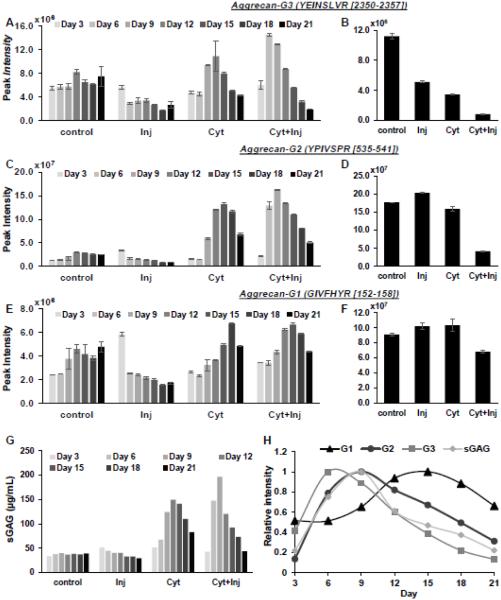
Figure 2. Aggrecan degradation kinetics.
Degradation kinetics of aggrecan G3, G2, and G1 peptides released into the medium (A, C, E) and remained in the explant (B, D, F) measured by MRM mass spectrometry. Values are average peak intensities of two technical replicates +/− standard deviation. G. GAG released into the medium for the 21 day incubation period measured by DMMB assay. H. Plot of release of G1, G2, G3 and sGAG into the medium over a 21 day time period for the cyt + inj treatment condition. Values are normalized to the maximum value.

