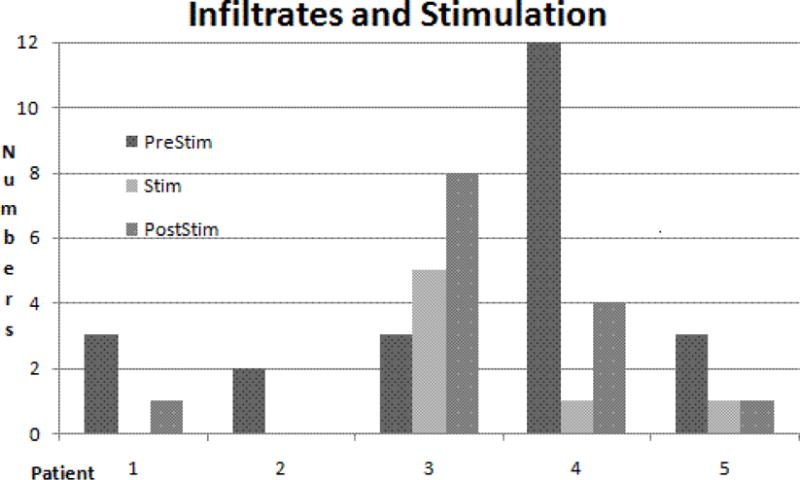
Fig. 1.

Distribution of numbers of cumulated pulmonary infiltrates over time. See Table 3 for numbers. Average was 4.6 before, 1.4 during and 2.8 after stimulation for all patients. There was no infiltrate during stimulation in patients #s 1 and 2, and marked reduction in the others except for patient # 3 where infiltrates increased in numbers with time. Note high prestim number in patient # 4 followed by sharp decline. X2 test indicates statistically significant differences between pre vs. stim and post stim (p = .001) when calculated for roughly equal observation times.
