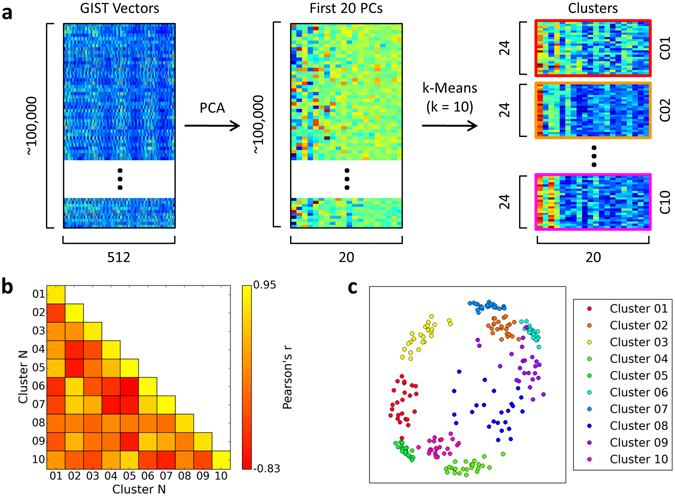
Figure 1.

GIST clustering process. The GIST descriptor18 comprises a vector of 512 values that represent the image in terms of the spatial frequencies and orientations present within each of 16 spatial locations across the image. (a) GIST descriptor vectors were calculated for every image in the SUN database. PCA was used to reduce dimensionality down to the first 20 components, and a k-Means clustering algorithm then used to select 10 clusters of scenes. Finally, the 24 images nearest the centroid of each cluster were selected to form the final stimulus set. The structure of the feature space is illustrated by the correlations similarity matrix (b) and multi-dimensional scaling plots (c). Examples of the images from each scene cluster are available at https://figshare.com/s/a7fdfa8742abf59e3672.
