
Figure 3.
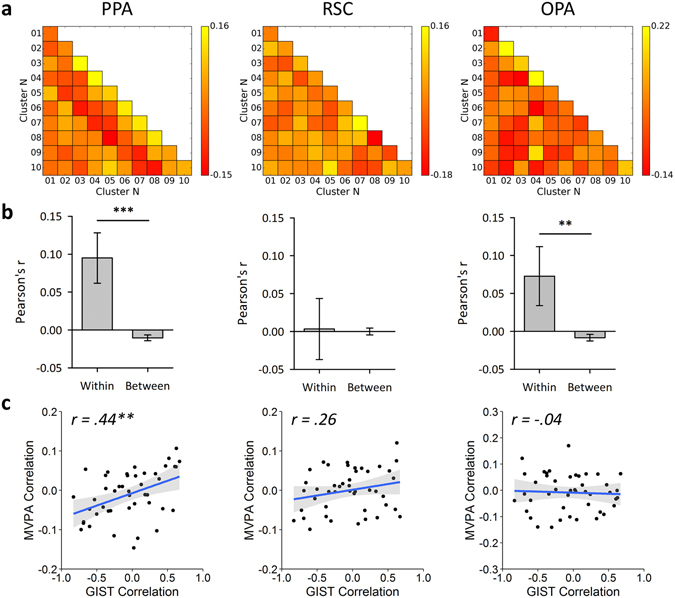
Main fMRI analyses for each scene region. (a) MVPA correlation similarity matrices. (b) Discrimination of scene clusters by contrasting within over between cluster correlation values; error bars represent 95% confidence intervals. (c) Results of representational similarity analyses between the off-diagonal elements of the MVPA and GIST model similarity matrices; shaded regions represent 95% confidence intervals. (***p < 0.001, **p < 0.01, *p < 0.05).