
Figure 2.
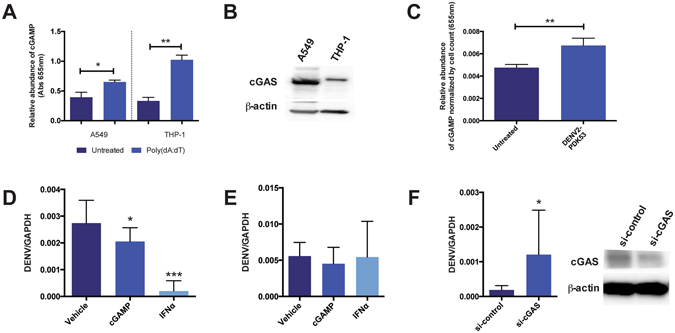
DENV infection activates cGAS-dependent antiviral responses. (A) In vitro assay for functional cGAS expression in A549 and THP-1 cell lysates as indicated by the production of cGAMP in the presence of 1 μg/ml poly(dA:dT). Results demonstrate that cGAS is functional in A549 as it is in THP-1, as shown previously3. (B) Western blot analysis of cGAS expression in A549 and THP-1 cells (control). THP-1 cells used as positive control and not as point of comparison for cGAS expression levels between A549 and THP-1 cell lines. (C) cGAMP production in A549 cells that are uninfected or infected with DENV2-PDK53 at MOI 1 for 24 hrs. Absorbance values normalized by cell count of each group. Results shown are representative of at least three independent experiments. (D,E) DENV RNA levels in infected A549 cells that were pre-treated (D) or post-treated (E) with 1 μg/ml cGAMP or 250 units/ml IFNα. Results are normalized by GAPDH expression and represent mean ± SD of at least four independent experiments. (F) DENV RNA levels in cGAS knockdown (si-cGAS) A549 cells compared to siRNA scrambled control (si-control) when infected with DENV2-PDK53 at MOI 1 for 24 hrs, assessed by RT-qPCR and normalized by GAPDH expression. Western blot confirmation of decreased cGAS expression in si-cGAS A549 cells, normalized with β-actin. Data is represented as mean ± SD of at least three independent experiments. In this figure, *depicts P < 0.05; **depicts P < 0.01 and ***depicts P < 0.001.