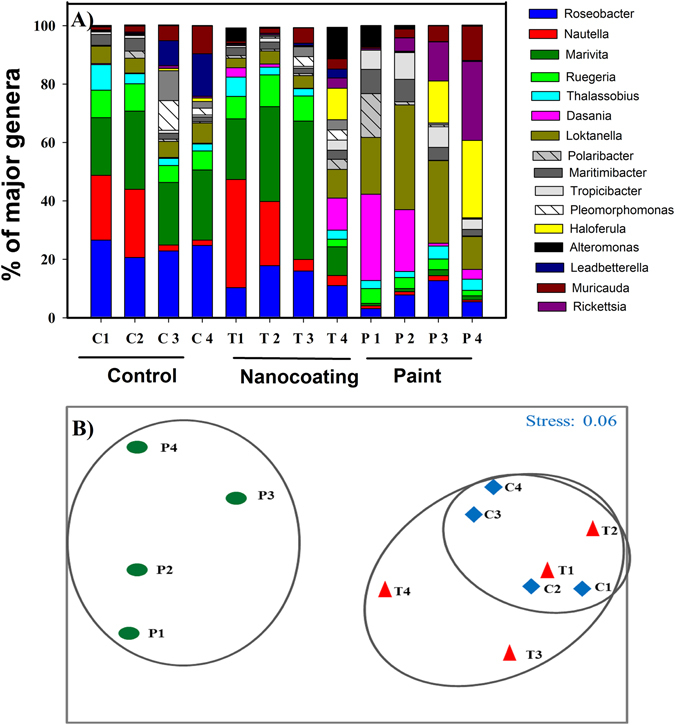
Figure 4.

Community composition of major fouling bacteria and cluster analysis. (A) Stacked bar chart showing the relative abundance (%) of major bacterial genera present on the control (C), nanocoated (T) and AF painted (P) net substrates during exposure in marina. 1–4 represents samples collected on weeks 1 to 4. Reported values represent average value obtained from three replicates. Bacterial genera contributing <5% are not shown. (B) MDS plot showing the clustering of major bacterial genera present on the control (C), nanocoated (T) and AF painted (P) net substrates during one month exposure in marina. 1–4 represents samples collected on weeks 1 to 4.
