
Figure 1.
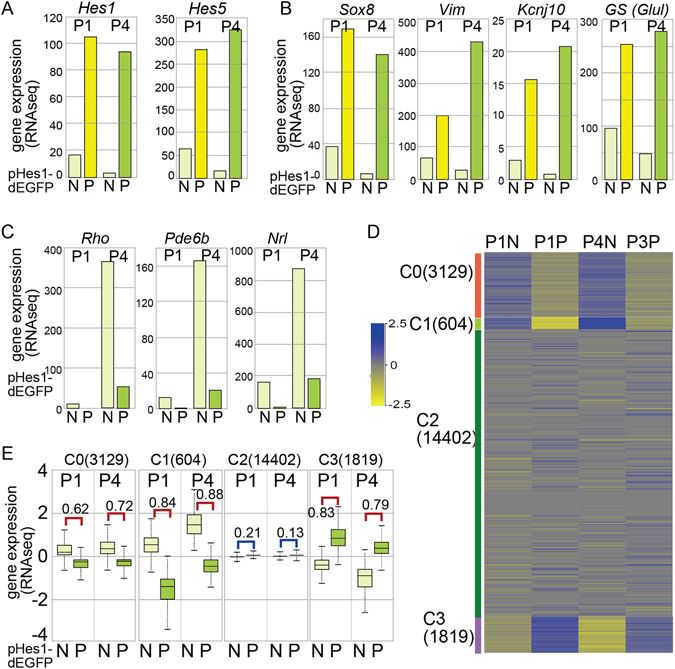
Fractionation of retinal cells by EGFP expression from pHes1-EGFP transgenic mouse retina. (A,B,C) RNA-seq using purified EGFP positive (P) and negative (N) cells of retina from pHes1-EGFP mouse at P1 and P4 was done. RNA-seq values of genes related to Müller glia (A,B) or photoreceptor (C) are shown. (D,E) Unsupervised K-means clustering of all genes on the RNA-seq to generate 4 clusters was done (D), and the distribution of gene expression of the clusters 0, 1, 2, and 3 in pHes1-EGFP positive (P) and negative (N) populations are shown (E). Numbers in parentheses are gene number in each cluster. Statistical analysis was done by student’s t test, and effect size of the results was examined by Pearson’s correlation coefficient (r) and indicated in the figure. N, negative; P, positive.