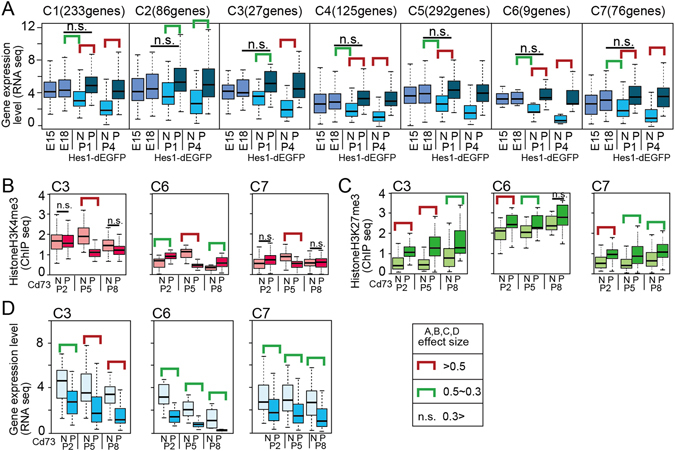
Figure 3.

Characterization of genes commonly upregulated in P1 and P4 pHes1 EGFP positive cell populations. (A) Genes that expressed higher levels in pHes1-EPC than in pHes1-ENC at both P1 and P4 were sub-clustered to C1 to C7 by using their values of H3K4me3 and H3K27me3 ChIP-seq of Cd73_P and Cd73_N retinal fractions13. Average and distribution of gene expression levels (RNA-seq) are shown by box plot. RNA-seq data obtained from whole retina at E15 and E1813 are also shown. (B–D) Distribution of H3K4me3 (ChIP-seq, B), H3K27me3 (ChIP-seq, C), and transcripts level (RNA-seq, D) of genes in each sub-cluster are shown. ChIP-seq and RNA-seq were performed by using Cd73_P and Cd73_N retinal sub-fractions at P2, P5, and P813. Green and red bars indicate statistical significant. p values were calculated by student’s T test, and effect size of the results was examined by Pearson’s correlation coefficient (r). r; Red bar >0.5, 0.5> green bar >0.3, n.s. <0.3.
