
Figure 6.
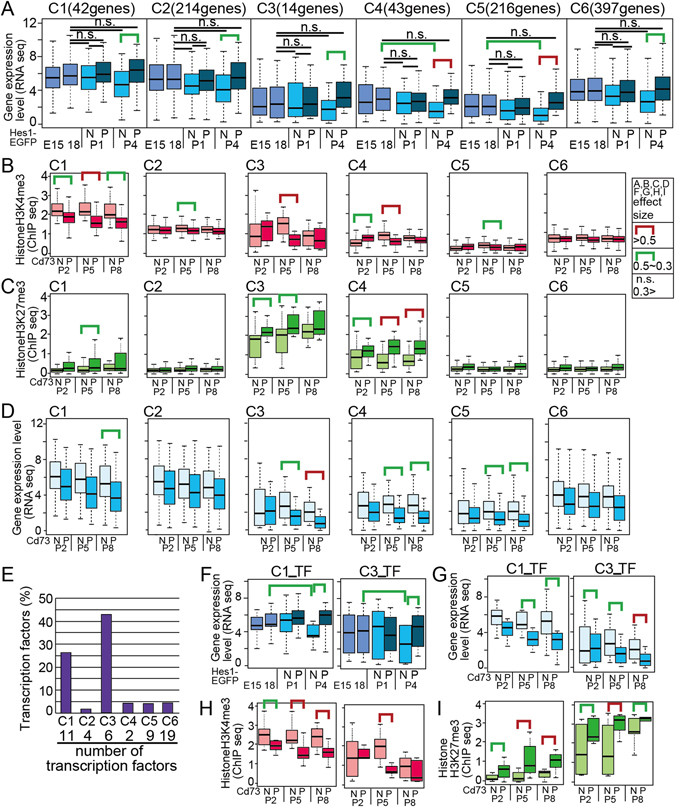
Characterization of genes upregulated in P4 but not in P1 in pHes- EGFP positive cell populations. Genes of pHes1-EPG at P4 but not included in pHes1-EPG at P1 were sub-clustered to C1 to C7 by using their values of H3K4me3 and H3K27me3 ChIP-seq of Cd73_P and Cd73_N fractions13, and distribution of gene expression levels (RNA-seq) in each cluster are shown by box plot (A). (B–D) Box plots of distribution of H3K4me3 (ChIP-seq, B), H3K27me3 (ChIP-seq, C), and transcripts level (RNA-seq, D) of genes in each sub-cluster are shown. ChIP-seqs and RNA-seq were performed by using Cd73_P and Cd73_N retinal sub-fractions at P2, P5, and P813. (E) Percentage of genes categorized to transcription factors by IPA in total number of genes in the clusters is shown. (F–I) Distribution of gene expression levels in pHes1-EPC or pHes1-ENC (F), or in Cd73_P and Cd73_N (G). Levels of H3K4me3 (H) and H3K27me3 (I) of Cd73_P and Cd73_N fractions of the transcription factors in each cluster are shown.