
Figure 7.
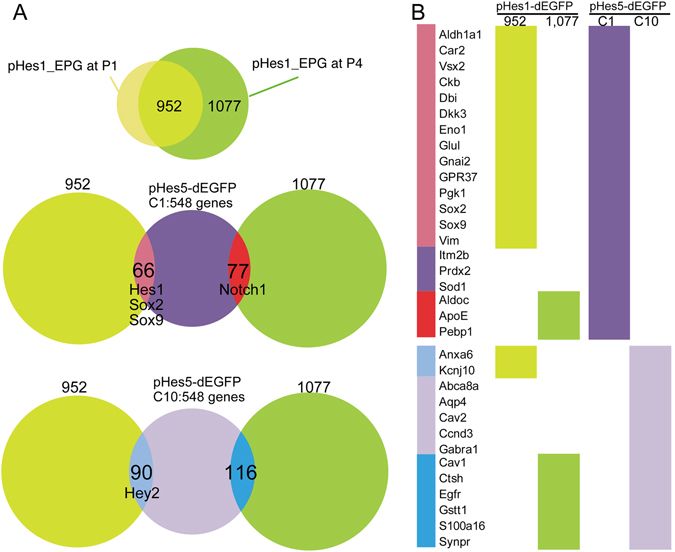
Comparison of gene expression patterns of pHes1-EGFP positive cells and pHes5-EGFP positive cells. (A) Schematic diagram of comparison of the gene expression. Venn diagram showing overlapping of genes of pHes1-EPG at P1 and P4 (upper panel), and these genes with pHes5-EGFP C1 genes27 (middle panel), and these genes with pHes5-EGFP C10 genes27 (lowest panel). (B) The genes enriched in Müller glia and/or in astrocytes27 are shown in the left column, and colors in the right column indicate which subgroup the genes were found. CRLBP-1 and Gnb1l were not listed in both pHes1-EGFP and pHes5-EGFP gene list.