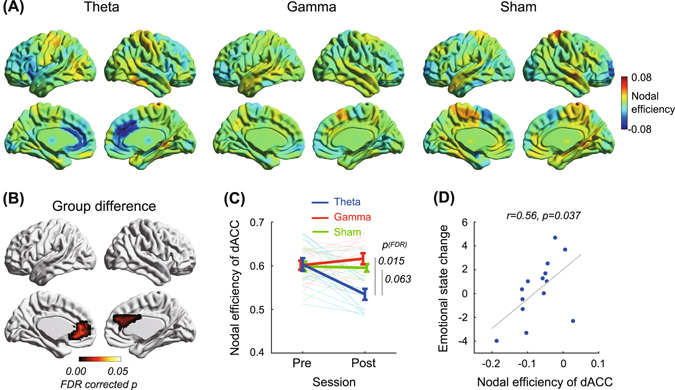
Figure 2.

Effects of tACS on nodal efficiency. (A) Bilateral and medial views of nodal efficiency changes (represented by average of network density 0.2–0.3) in theta band, gamma band, and sham tACS groups. Hot and cool colors denote increase or decrease of nodal efficiency, respectively. (B) Significant group difference of nodal efficiency. FDR-corrected p-values were obtained by a permutation test (iteration: 5000), and multiple comparison corrections were applied at the node level. (C) Nodal efficiency changes in dorsal anterior cingulate cortex (dACC) are shown in average (thick line) and individual (light thin line) levels. Error bars denote standard error. (D) Relationship between nodal efficiency change of dACC and emotional state change.
