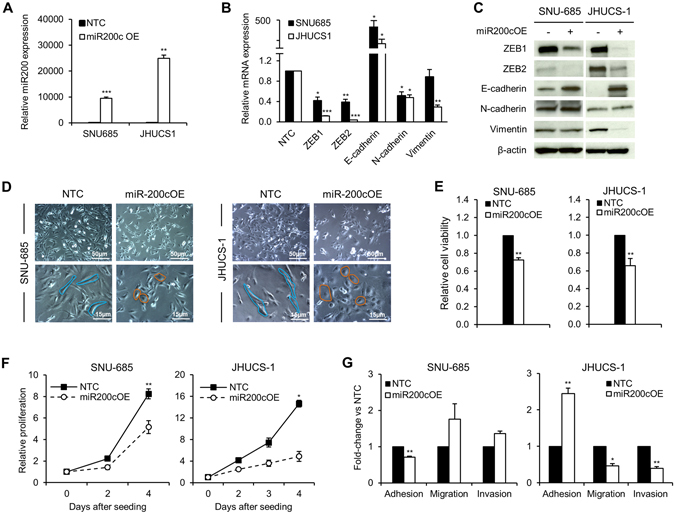
Figure 3.

Effects of ectopic miR-200 overexpression in UCS cell lines. (A) miR-200c overexpression in SNU-685 and JHUCS-1 cell lines. Bar graphs represent relative miR-200c expression. Data are normalized to non-targeting controls (NTC). (B) Relative mRNA expression of EMT markers. miR-200c overexpression data are normalized to NTC. Changes in SNU-685 vimentin mRNA expression were not statistically significant. (C) Protein expression of EMT markers by immunoblotting. Anti-β-actin serves as a loading control. (D) Morphologic changes in miR-200c-overexpressed UCS cells. Rows represent lower (top) and higher (bottom) magnifications. The spindle-shaped, elongated control cells are outlined in blue. The cobblestone-shaped miR-200c-overexpressed cells are outlined in orange. (E) Relative cell viability measured by VisionBlue™ assay 2 days (SNU-685) and 3 days (JHUCS-1) after seeding. Data are normalized to NTC. (F) Relative proliferation measured by cell counts. Data are normalized to Day 0. (G) Relative adhesion, migration and invasion. There were no statistically significant differences in migration or invasion between miR-200c-overexpressed and control SNU-685 cells. All graphical data are reported as mean ± SD. *P < 0.05, **P ≤ 0.01, ***P ≤ 0.001; paired sample t-test.
