
Figure 4.
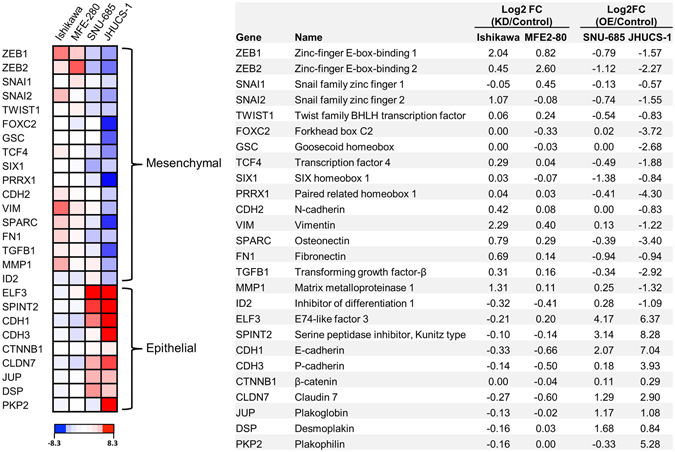
Differential expression of EMT/MET-related genes in EAC-miR-200 depleted and UCS-miR-200 overexpressed cells. (A) Heatmap of RNA expression for 26 EMT/MET-related genes. Relative RNA expression of miR-200b/c-depleted vs scramble-treated Ishikawa and MFE-280 cells, and miR-200c-overexpressed vs non-targeting control treated SNU-685 and JHUCS-1 cells, are shown. Increased and decreased expression are depicted in red and blue, respectively. The top 17 genes are known to have increased expression in the mesenchymal phenotype, while the bottom 9 genes are known to have increased expression in the epithelial phenotype. Relative expression is calculated by log2 fold-change (B).