Figure 5.

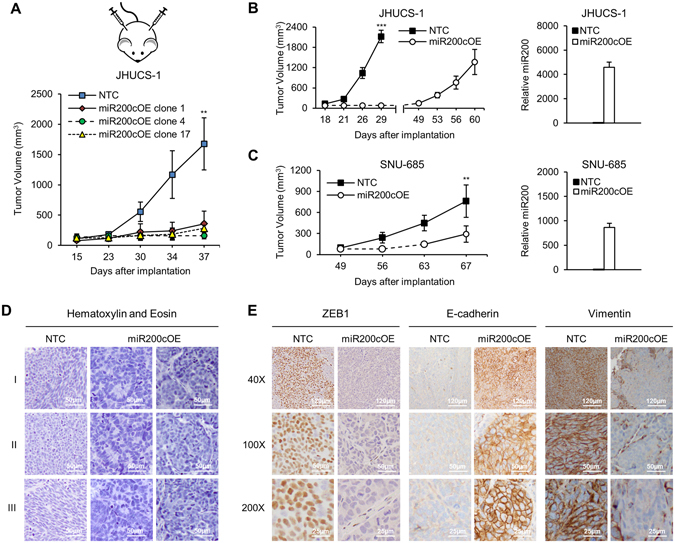
miR-200 overexpression in UCS xenograft tumor models. NSG mice were subcutaneously injected with miR-200c-overexpressed and control cells. (A) Tumor growth in control vs. 3 different miR-200c-overexpressed JHUCS-1 clones over 37 days (n = 4 per group). (B) JHUCS-1 and (C) SNU-685 tumor growth in mice bearing miR-200c-overexpressed vs. control cells over 60 and 67 days, respectively (n = 5 per group). Bar graphs depict relative miR-200c expression in xenografted tumors. All graphical data are reported as mean ± SD. **P ≤ 0.01, ***P ≤ 0.001; Student’s T-test for independent samples. (D) H&E staining of JHUCS-1 xenografted tumors. All images were taken at 100X magnification. Scale bar, 50 µm. Rows I, II and III represent different sections of tumor. All NTC were comprised of predominantly spindled cells. (E) IHC for ZEB1 (nuclear), E-cadherin (membranous) and vimentin (cytoplasmic). For tumors with complete loss of protein expression, staining of blood vessels and stromal cells served as internal positive controls. Rows represent increasing magnification from top to bottom.
