Figure 4.

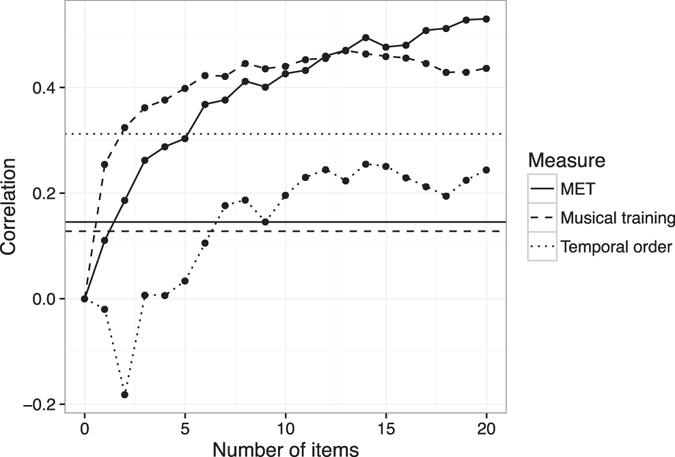
Pearson correlations with validity measures as a function of test length (test Version 1). The three horizontal lines indicate two-tailed thresholds of statistical significance at p < 0.05 for the respective validity measures.

Pearson correlations with validity measures as a function of test length (test Version 1). The three horizontal lines indicate two-tailed thresholds of statistical significance at p < 0.05 for the respective validity measures.