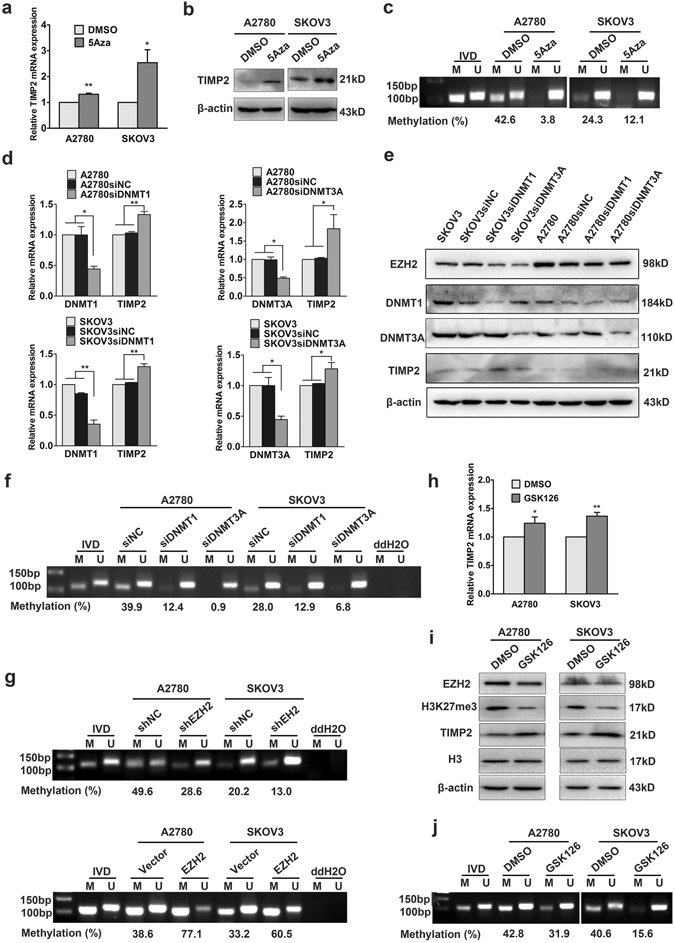
Figure 5.

EZH2 inhibits TIMP2 expression via DNA methylation. (a) qRT-PCR and (b) Western blot analysis of TIMP2 expression in A2780 and SKOV3 cells after treatment with 5Aza. The cropped blots are used in the figure, and full-length blots are presented in Supplementary Fig. S11. (c) Methylation-specific PCR (MSP) analysis revealed that 5Aza treatment markedly decreased TIMP2 promoter methylation. The cropped gel is used in the figure, and the full-length gel is presented in Supplementary Fig. S12. M, methylated; U, unmethylated; IVD, in vitro methylated DNA; methylation index refers to the percentage of M/M + U. (d) qRT-PCR and (e) Western blot analysis of TIMP2 expression in A2780 and SKOV3 cells after DNMT1 and DNMT3A siRNA transfection. The cropped blots are used in the figure, and full-length blots are presented in Supplementary Fig. S13. (f) MSP for DNA methylation status of the TIMP2 promoter in ovarian cancer cells after DNMT1 and DNMT3A siRNA transfection. The cropped gel is used in the figure, and the full-length gel is presented in Supplementary Fig. S14. (g) MSP for DNA methylation status of the TIMP2 promoter in the EZH2-regulated ovarian cancer cells. The cropped gels are used in the figure, and full-length gels are presented in Supplementary Fig. S15. (h) qRT-PCR and (i) Western blot analysis of TIMP2 expression in A2780 and SKOV3 cells after treatment with GSK126. The cropped blots are used in the figure, and full-length blots are presented in Supplementary Fig. S16. (j) MSP analysis of TIMP2 promoter methylation in A2780 and SKOV3 cells after treatment with GSK126. The cropped gels are used in the figure, and full-length gels are presented in Supplementary Fig. S17. *P < 0.05; **P < 0.01; ***P < 0.001.
