
Figure 7.
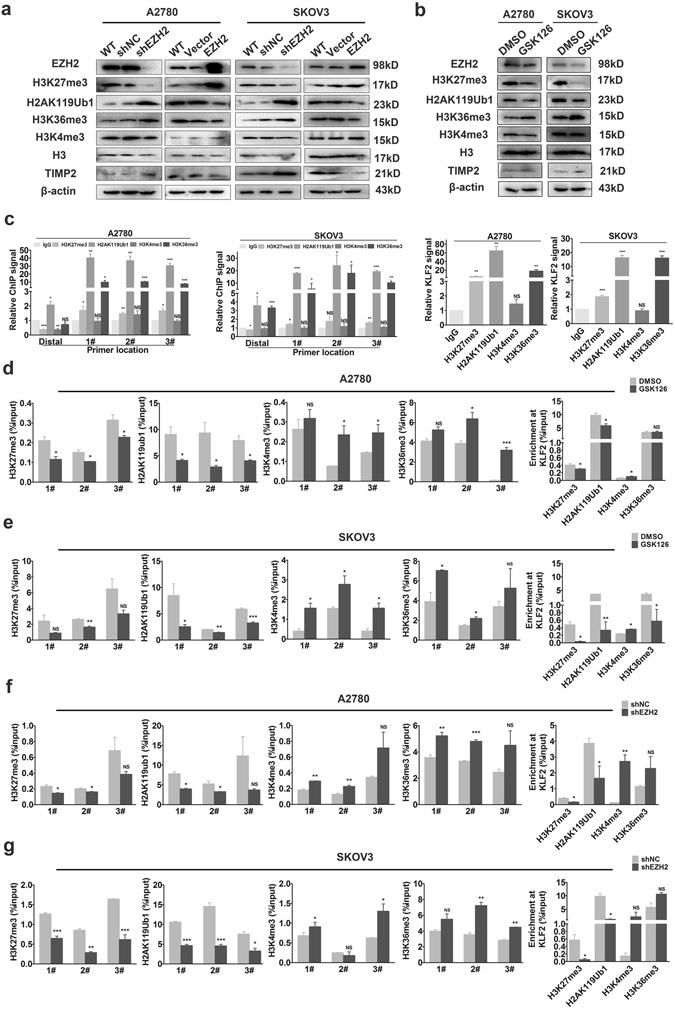
Inhibition of EZH2 converts histone modification mark occupancy at the TIMP2 promoter. (a) Western blot analysis of different histone modification marks in A2780 and SKOV3 cells after EZH2 knockdown or pharmacological inhibition by GSK126 treatment (b). The cropped blots are used in the figure, and full-length blots are presented in Supplementary Figs S18 and S19. (c) ChIP analysis of different histone modification marks at the TIMP2 promoter in A2780 and SKOV3 cells. IgG served as a negative control. (d,e) ChIP analysis of different histone modification marks at the TIMP2 promoter in A2780 and SKOV3 cells treated by GSK126. (f,g) ChIP analysis of different histone modification marks in EZH2-knockdown A2780 and SKOV3 cells. The results were normalized to the input. The EZH2 target gene KLF2 was used as a positive control. *P < 0.05; **P < 0.01; ***P < 0.001. NS, not significant.