
Figure 2.
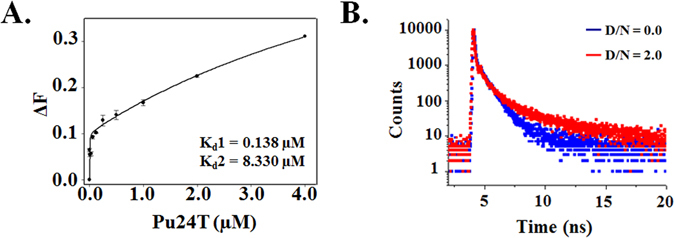
Steady state and time resolved fluorescence studies. (A) Fluorescence titration curve of Quercetin as a function of Pu24T concentration. Solid lines represent fit according to the ligand binding two site saturation model. Value of Binding constant(s) (Kd) are indicated at the bottom right side of the plot. (B) Fluorescence life time decay curve of 40.0 µM free Quercetin (Blue) and its complex with Pu24T DNA at D/N ratio = 2.0 (Red).