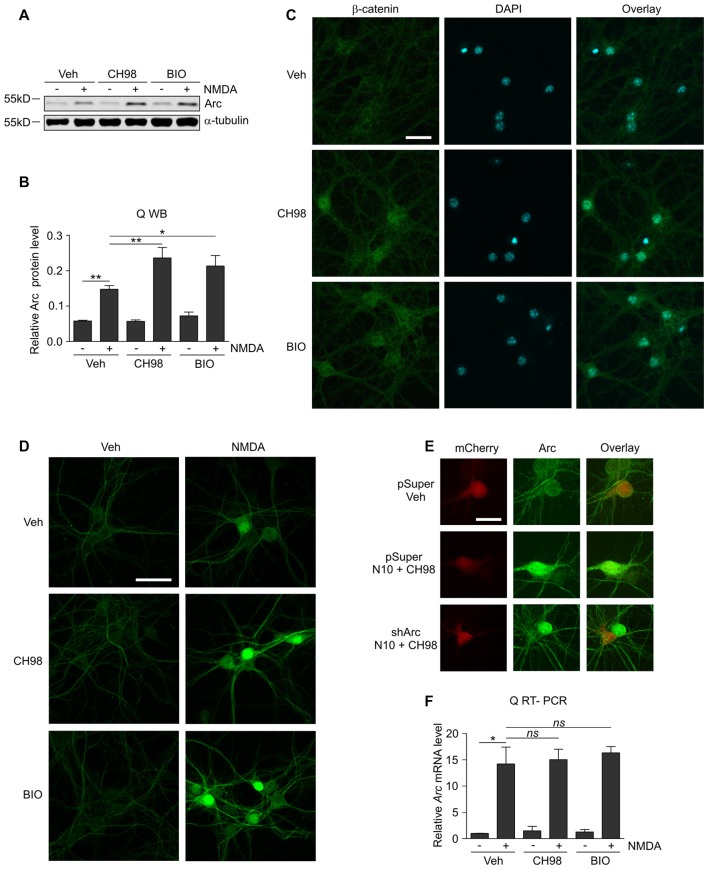
Figure 1.
Glycogen synthase kinases α and β (GSK3α/β) inhibition increases Arc protein but not Arc mRNA levels in N-methyl-D-aspartate (NMDA)-stimulated neurons. (A) NMDA receptors (NMDAR)-dependent increase in Arc protein levels is augmented by GSK3α/β inhibition. Western blot analysis of Arc and α-tubulin expression in cortical neurons on day in vitro (DIV) 14–16 pretreated with vehicle, 1 μM CH98, or 1 μM BIO for 1 h and exposed for 4 h to 10 μM NMDA. (B) Quantification of Arc protein expression in neurons treated as in (A), normalized to α-tubulin level. The data are expressed as mean ± standard error of the mean (SEM; n = 6 independent cultures). *p < 0.05, **p < 0.01 indicates statistical significance of the obtained results, estimated with one-way ANOVA with Bonferroni correction for multiple comparisons. (C) GSK3α/β inhibitors efficiently block β-catenin (i.e., the canonical target of GSK3α/β) degradation in neurons and promote its nuclear accumulation. Representative confocal images of β-catenin immunofluorescence in hippocampal neurons that were incubated with vehicle, 1 μM CH98, or 1 μM BIO for 4 h, fixed, immunolabeled for β-catenin, and stained with DAPI to visualize chromatin. Scale bar = 25 μm. (D) GSK3α/β inhibition promotes Arc accumulation in dendrites and nucleus of NMDA-stimulated neurons. The figure shows representative confocal images of Arc immunofluorescence in hippocampal neurons that were pretreated with vehicle or 1 μM CH98 or 1 μM BIO for 1 h and treated with 10 μM NMDA for 4 h. Scale bar = 50 μm. (E) Arc knockdown prevents NMDA and GSK3 inhibition-dependent increase in Arc immunofluorescence. The figure shows representative confocal images of Arc immunofluorescence in hippocampal neurons that were transfected on DIV12–13 with control vector (pSuper) or the mix of pSuper plasmids encoding shRNA against Arc mRNA together with β-actin-mCherry plasmid to visualize transfected cells. Two days postransfection cells were treated for 4 h as indicated. Scale bar = 25 μm. (F) GSK3α/β inhibition does not affect NMDAR-dependent Arc mRNA expression. The figure shows the results of the analysis of Arc mRNA levels in neurons that were stimulated with NMDA and GSK3α/β inhibitors. Cortical neurons were pretreated with GSK3α/β inhibitors, and Arc expression was induced with 10 μM NMDA for 2 h. Arc mRNA levels were determined by RT-qPCR, and the values were compared with controls (Arc mRNA levels in vehicle-treated cells). The data are expressed as mean ± SEM (n = 4 independent cultures). *p < 0.05 (one-way ANOVA with Bonferroni correction for multiple comparisons).

